

Answered step by step
Verified Expert Solution
Question
1 Approved Answer
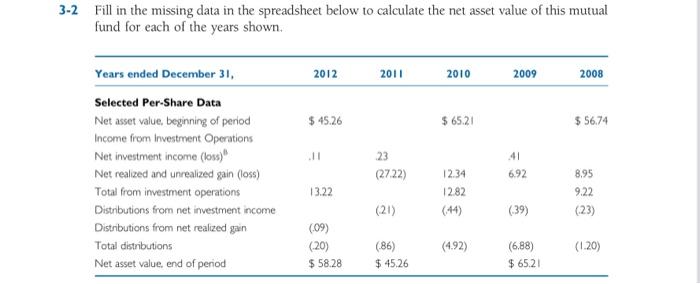
3-2 Fill in the missing data in the spreadsheet below to calculate the net asset value of this mutual fund for each of the years
Step by Step Solution
There are 3 Steps involved in it
Step: 1

Get Instant Access to Expert-Tailored Solutions
See step-by-step solutions with expert insights and AI powered tools for academic success
Step: 2

Step: 3
Ace Your Homework with AI
Get the answers you need in no time with our AI-driven, step-by-step assistance
Get Started
Short Term Financial Management
Authors: Ned C. Hill, William L. Sartoris
3rd Edition
0023548320, 978-0023548321