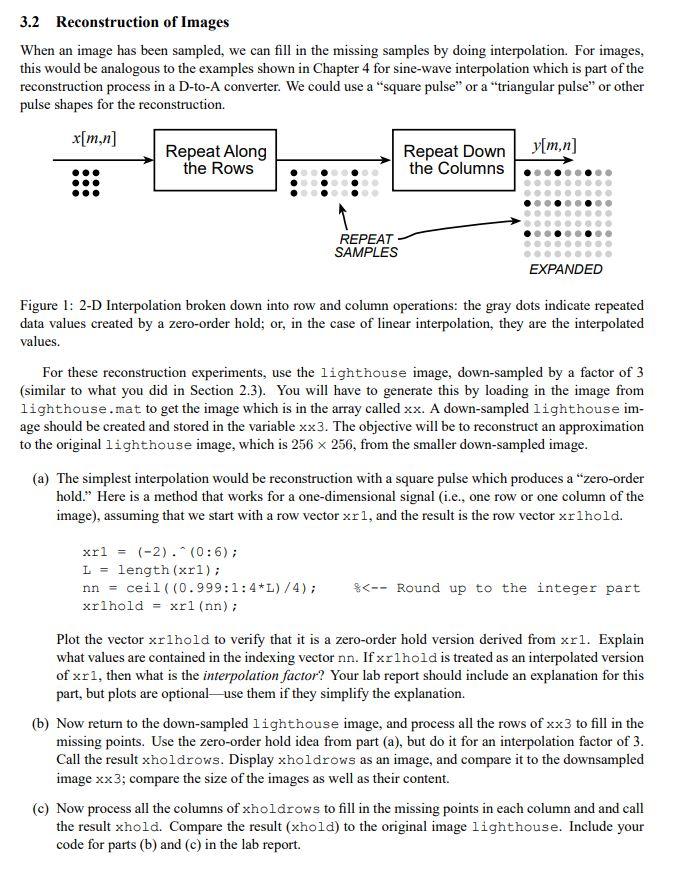
3.2 Reconstruction of Images When an image has been sampled, we can fill in the missing samples by doing interpolation. For images, this would be analogous to the examples shown in Chapter 4 for sine-wave interpolation which is part of the reconstruction process in a D-to-A converter. We could use a "square pulse" or a "triangular pulse" or other pulse shapes for the reconstruction. Figure 1: 2-D Interpolation broken down into row and column operations: the gray dots indicate repeated data values created by a zero-order hold; or, in the case of linear interpolation, they are the interpolated values. For these reconstruction experiments, use the lighthouse image, down-sampled by a factor of 3 (similar to what you did in Section 2.3). You will have to generate this by loading in the image from lighthouse.mat to get the image which is in the array called x. A down-sampled lighthouse image should be created and stored in the variable 3. The objective will be to reconstruct an approximation to the original lighthouse image, which is 256256, from the smaller down-sampled image. (a) The simplest interpolation would be reconstruction with a square pulse which produces a "zero-order hold." Here is a method that works for a one-dimensional signal (i.e., one row or one column of the image), assuming that we start with a row vector r1, and the result is the row vector r1 hold. xr1=(2)(0:6); L= length (xr1); nn = ceil ((0.999:1:4L)/4); s-- Round up to the integer part xrlhold=xr1(nn); Plot the vector r1hold to verify that it is a zero-order hold version derived from r1. Explain what values are contained in the indexing vector nn. If xr1hold is treated as an interpolated version of r1, then what is the interpolation factor? Your lab report should include an explanation for this part, but plots are optional-use them if they simplify the explanation. (b) Now return to the down-sampled lighthouse image, and process all the rows of 3 to fill in the missing points. Use the zero-order hold idea from part (a), but do it for an interpolation factor of 3. Call the result xholdrows. Display xholdrows as an image, and compare it to the downsampled image x3; compare the size of the images as well as their content. (c) Now process all the columns of xholdrows to fill in the missing points in each column and and call the result xhold. Compare the result (xhold) to the original image lighthouse. Include your code for parts (b) and (c) in the lab report. 3.2 Reconstruction of Images When an image has been sampled, we can fill in the missing samples by doing interpolation. For images, this would be analogous to the examples shown in Chapter 4 for sine-wave interpolation which is part of the reconstruction process in a D-to-A converter. We could use a "square pulse" or a "triangular pulse" or other pulse shapes for the reconstruction. Figure 1: 2-D Interpolation broken down into row and column operations: the gray dots indicate repeated data values created by a zero-order hold; or, in the case of linear interpolation, they are the interpolated values. For these reconstruction experiments, use the lighthouse image, down-sampled by a factor of 3 (similar to what you did in Section 2.3). You will have to generate this by loading in the image from lighthouse.mat to get the image which is in the array called x. A down-sampled lighthouse image should be created and stored in the variable 3. The objective will be to reconstruct an approximation to the original lighthouse image, which is 256256, from the smaller down-sampled image. (a) The simplest interpolation would be reconstruction with a square pulse which produces a "zero-order hold." Here is a method that works for a one-dimensional signal (i.e., one row or one column of the image), assuming that we start with a row vector r1, and the result is the row vector r1 hold. xr1=(2)(0:6); L= length (xr1); nn = ceil ((0.999:1:4L)/4); s-- Round up to the integer part xrlhold=xr1(nn); Plot the vector r1hold to verify that it is a zero-order hold version derived from r1. Explain what values are contained in the indexing vector nn. If xr1hold is treated as an interpolated version of r1, then what is the interpolation factor? Your lab report should include an explanation for this part, but plots are optional-use them if they simplify the explanation. (b) Now return to the down-sampled lighthouse image, and process all the rows of 3 to fill in the missing points. Use the zero-order hold idea from part (a), but do it for an interpolation factor of 3. Call the result xholdrows. Display xholdrows as an image, and compare it to the downsampled image x3; compare the size of the images as well as their content. (c) Now process all the columns of xholdrows to fill in the missing points in each column and and call the result xhold. Compare the result (xhold) to the original image lighthouse. Include your code for parts (b) and (c) in the lab report