Answered step by step
Verified Expert Solution
Link Copied!

Question

1 Approved Answer

3.2.4. Calculate the area parallelogram BCCor 1.2.5 Prove by calculations The area of a rhombus FCCE - sees of parallelogram Crop QUESTION 4 In the
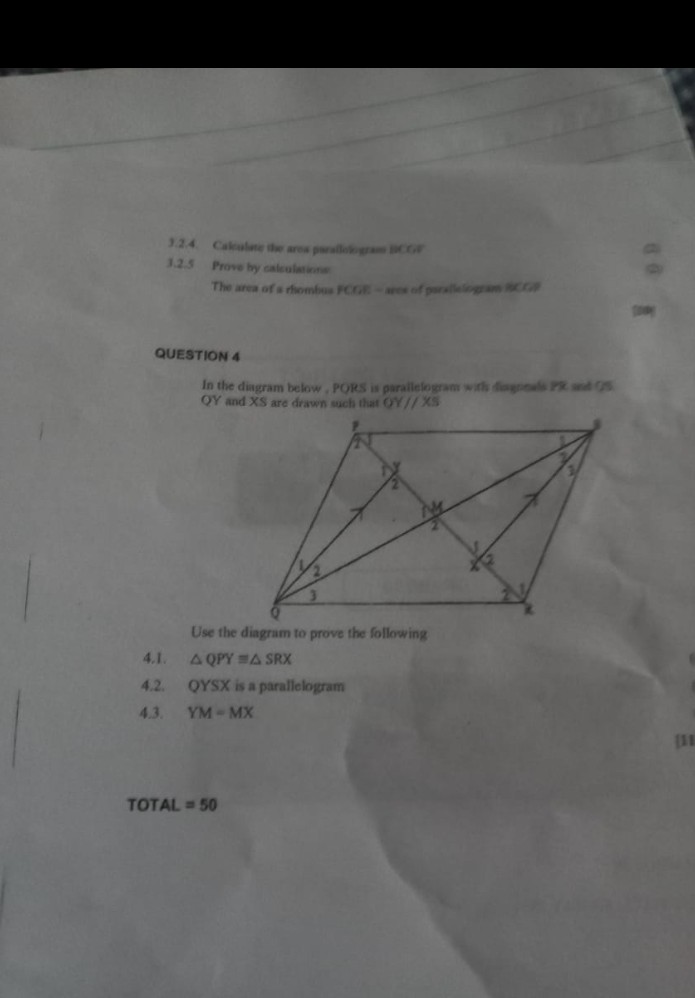
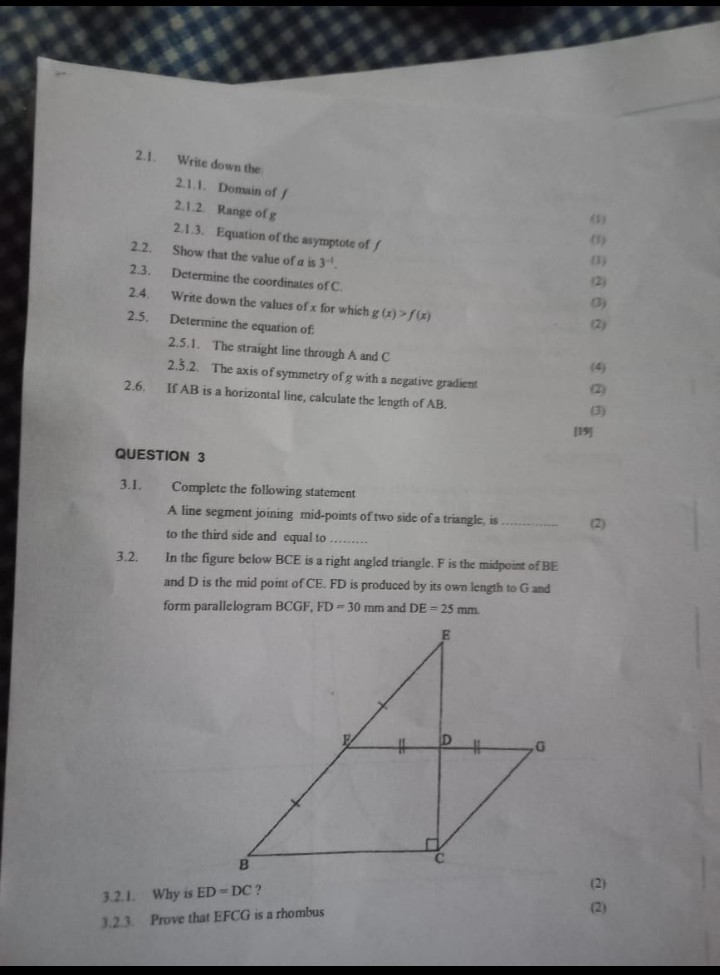
image text in transcribedimage text in transcribedimage text in transcribed
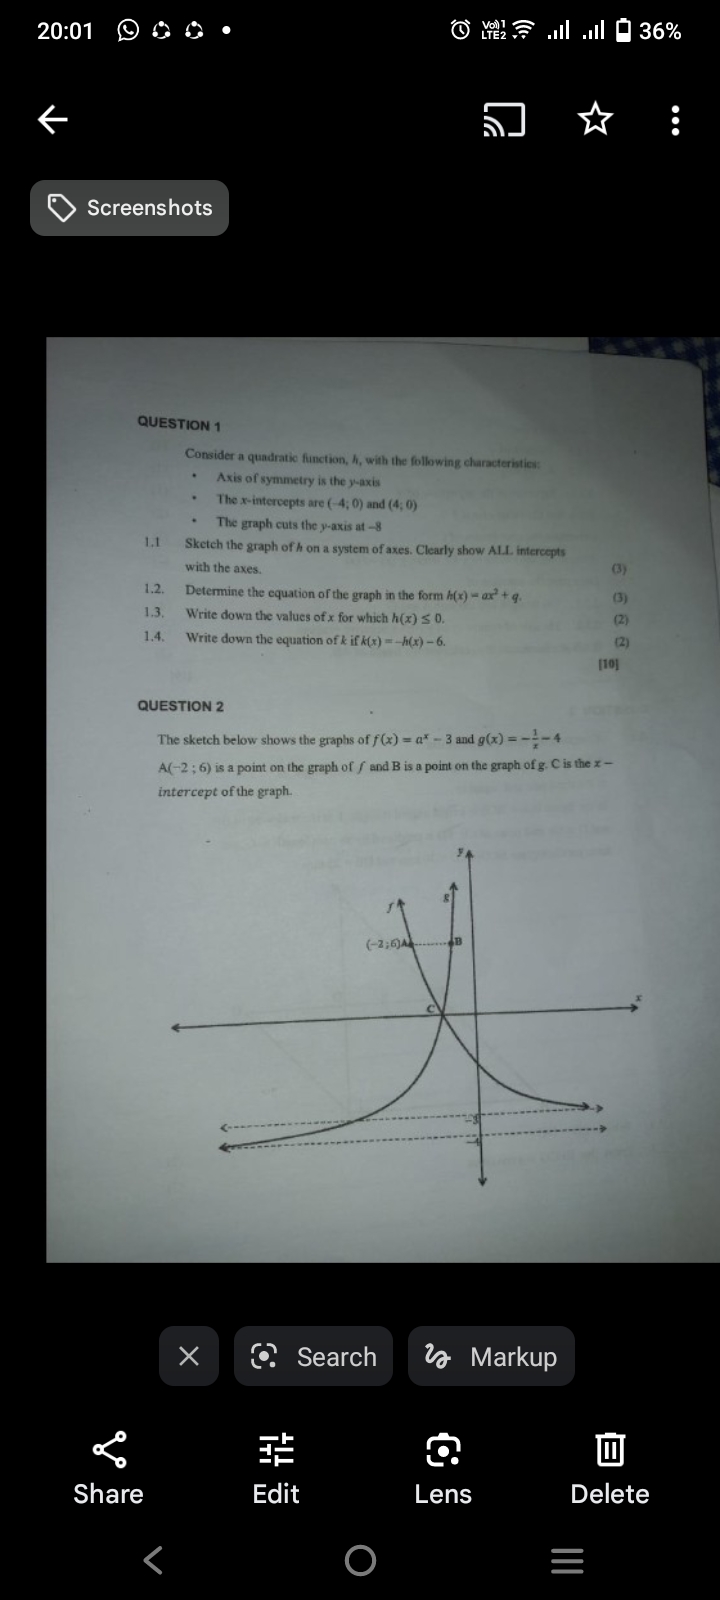
3.2.4. Calculate the area parallelogram BCCor 1.2.5 Prove by calculations The area of a rhombus FCCE - sees of parallelogram Crop QUESTION 4 In the diagram below , PORS is parallelogram with dingpouts PX and US QY and XS are drawn such that OY // XS Use the diagram to prove the following 4.1. A QPY =A SRX 4.2. QYSX is a parallelogram 4.3. YM -MX TOTAL = 502.1. Write down the 2.1.1. Domain of / 2.1.2. Range of g 2.1.3. Equation of the asymptote of f 2.2. Show that the value of a is 3-1 2.3. Determine the coordinates of C. 2.4. Write down the values of x for which g (x) > f(x) 2.5. Determine the equation of. 2.5.1. The straight line through A and C (4) 2.3.2. The axis of symmetry of g with a negative gradient 2.6. If AB is a horizontal line, calculate the length of AB. 119% QUESTION 3 3.1. Complete the following statement A line segment joining mid-points of two side of a triangle, is . (2) to the third side and equal to ........ 3.2 In the figure below BCE is a right angled triangle. F is the midpoint of BE and D is the mid point of CE. FD is produced by its own length to G and form parallelogram BCGF, FD = 30 mm and DE = 25 mm. (2) (2) 3.2,1. Why is ED = DC ? 3.2.3. Prove that EFCG is a rhombus20:01 06 0 . Y Il .1 36% . .. Screenshots QUESTION 1 Consider a quadratic function, h, with the following characteristics: Axis of symmetry is the y-axis The x-intercepts are ( 4; 0) and (4; 0) The graph cuts the y-axis at -8 1,1 Sketch the graph of h on a system of axes. Clearly show ALL intercepts with the axes. (3) Determine the equation of the graph in the form A(x) - ax + g. (3) 1.3. Write down the values of x for which h(x) 5 0. (2) 1.4. Write down the equation of & if k(x) = -h(x) - 6. (2) [101 QUESTION 2 The sketch below shows the graphs of f(x) = a* - 3 and g(x) = -4-4 A(-2 ; 6) is a point on the graph of / and B is a point on the graph of g. C is the x - intercept of the graph X O Search Vo Markup II Share Edit Lens Delete K O
Step by Step Solution

There are 3 Steps involved in it

Step: 1

blur-text-image

Get Instant Access to Expert-Tailored Solutions

See step-by-step solutions with expert insights and AI powered tools for academic success

Step: 2

blur-text-image

Step: 3

blur-text-image

Ace Your Homework with AI

Get the answers you need in no time with our AI-driven, step-by-step assistance

Get Started

Recommended Textbook for

New Trends In Algebraic Geometry

Authors: K Hulek ,M Reid ,C Peters ,F Catanese

1st Edition

0521646596, 978-0521646598

More Books

Students also viewed these Mathematics questions

Question

What is focal length? Explain with a diagram and give an example.

Answered: 1 week ago