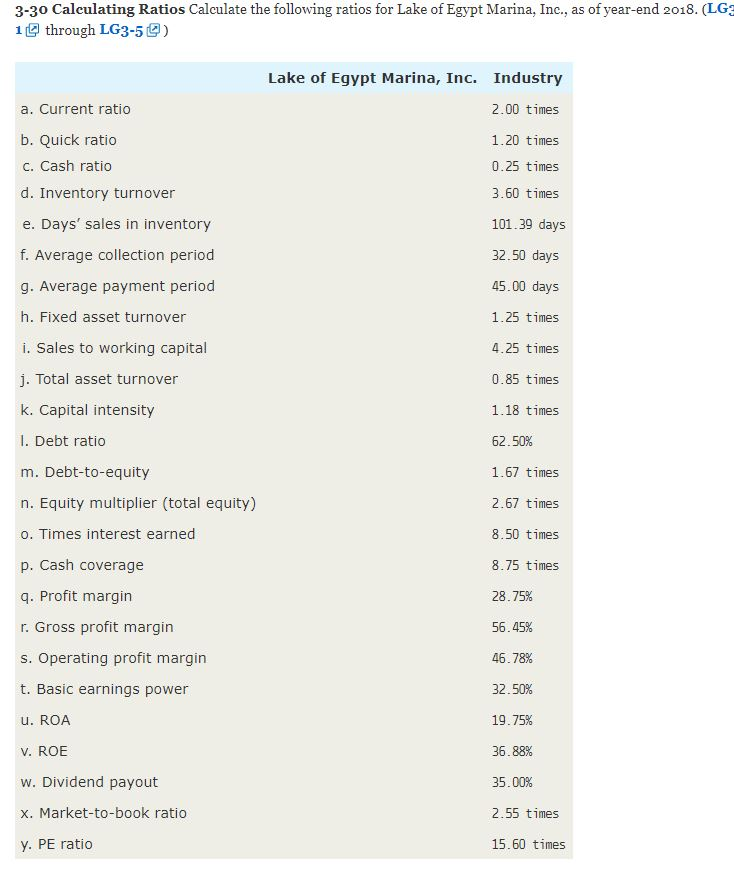
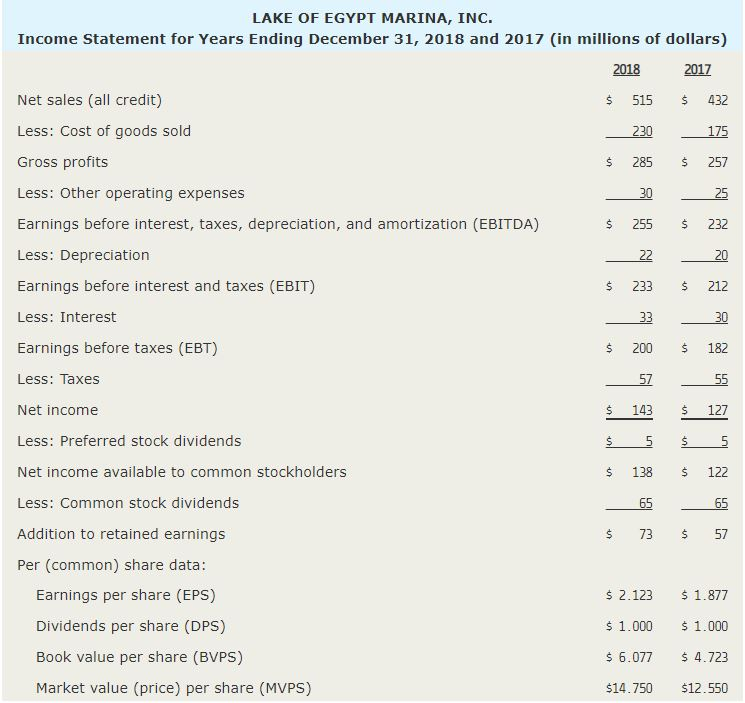
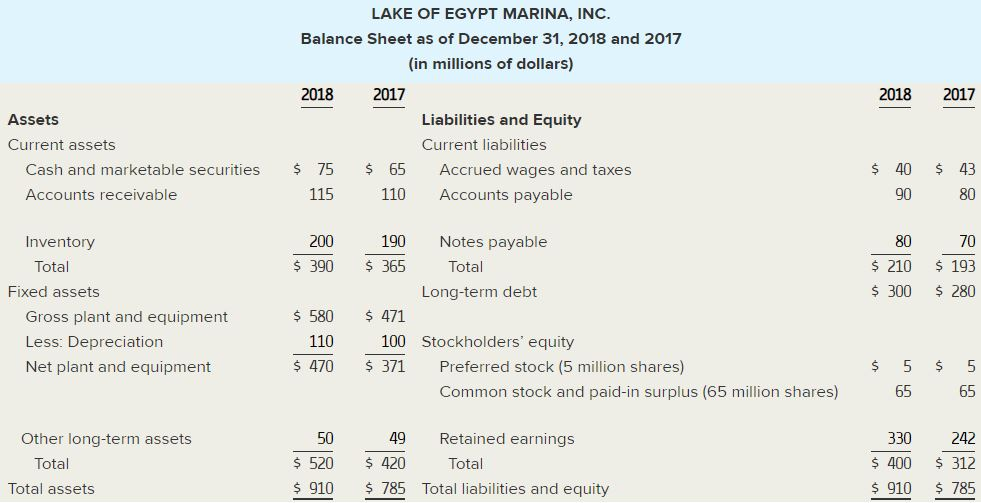
3-30 Calculating Ratios Calculate the following ratios for Lake of Egypt Marina, Inc., as of year-end 2018. (LG 1 through LG3-5) Lake of Egypt Marina, Inc. Industry 2.00 times 1.20 times 0.25 times 3.60 times a. Current ratio b. Quick ratio C. Cash ratio d. Inventory turnover e. Days' sales in inventory f. Average collection period g. Average payment period h. Fixed asset turnover i. Sales to working capital 101.39 days 32.50 days 45.00 days 1.25 times 4.25 times j. Total asset turnover 0.85 times k. Capital intensity 1.18 times 1. Debt ratio 62.50% m. Debt-to-equity 1.67 times 2.67 times n. Equity multiplier (total equity) o. Times interest earned 8.50 times 8.75 times 28.75% p. Cash coverage 9. Profit margin r. Gross profit margin s. Operating profit margin t. Basic earnings power 56.45% 46.78% 32.50% u. ROA 19.75% V. ROE 36.88% w. Dividend payout 35.00% X. Market-to-book ratio 2.55 times y. PE ratio 15.60 times 515 $ $ $ $ 255 $ 232 $ $ 30 $ $ LAKE OF EGYPT MARINA, INC. Income Statement for Years Ending December 31, 2018 and 2017 (in millions of dollars) 2018 2017 Net sales (all credit) $ 432 Less: Cost of goods sold 230 175 Gross profits 285 257 Less: Other operating expenses 30 25 Earnings before interest, taxes, depreciation, and amortization (EBITDA) Less: Depreciation 22 20 Earnings before interest and taxes (EBIT) 233 212 Less: Interest 33 Earnings before taxes (EBT) 200 182 Less: Taxes 57 55 Net income $ 127 Less: Preferred stock dividends Net income available to common stockholders $ 138 $ 122 Less: Common stock dividends 65 Addition to retained earnings 73 Per (common) share data: Earnings per share (EPS) $ 2.123 $ 1.877 Dividends per share (DPS) $ 1.000 $ 1.000 Book value per share (BVPS) $ 6.077 $ 4.723 Market value (price) per share (MVPS) $14.750 $12.550 $ $ 143 $ L $ $ 65 $ $ 57 2018 2017 LAKE OF EGYPT MARINA, INC. Balance Sheet as of December 31, 2018 and 2017 (in millions of dollars) 2018 2017 Liabilities and Equity Current liabilities $ 75 $ 65 Accrued wages and taxes 115 110 Accounts payable - Assets Current assets Cash and marketable securities Accounts receivable $ 40 90 $ 43 80 80 Inventory Total 200 $ 390 $ 210 $ 300 70 $ 193 $ 280 Fixed assets Gross plant and equipment Less: Depreciation Net plant and equipment $ 580 110 $ 470 190 Notes payable $ 365 Total Long-term debt $ 471 100 Stockholders' equity $ 371 Preferred stock (5 million shares) Common stock and paid-in surplus (65 million shares) $ 5 $ 5 65 65 50 330 Other long-term assets Total Total assets $ 520 $ 910 49 Retained earnings $ 420 Total $ 785 Total liabilities and equity $ 400 $ 910 242 $ 312 $ 785