Answered step by step
Verified Expert Solution
Question
1 Approved Answer
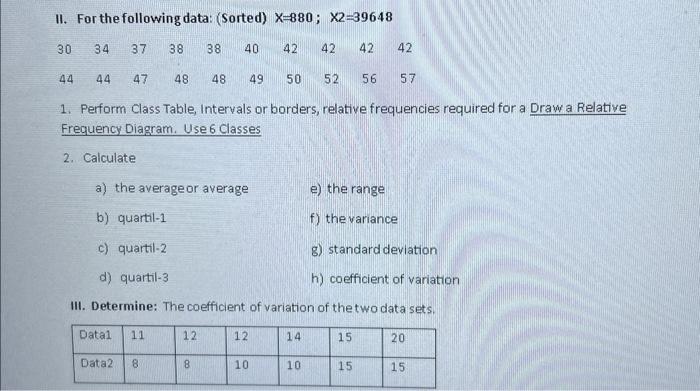
3.3.2 Help with this please. II. For the following data: (Sorted) X=880;X2=39648 1. Perform Class Table, Intervals or borders, relative frequencies required for a Draw
3.3.2 Help with this please. 
II. For the following data: (Sorted) X=880;X2=39648 1. Perform Class Table, Intervals or borders, relative frequencies required for a Draw a Relative Frequency Diagram. Use 6 Classes 2. Calculate a) the averageor average e) the range b) quartil-1 f) the variance c) quartil-2 g) standard deviation d) quartil-3 h) coefficient of variation III. Determine: The coefficient of variation of the two data sets 
Step by Step Solution
There are 3 Steps involved in it
Step: 1

Get Instant Access to Expert-Tailored Solutions
See step-by-step solutions with expert insights and AI powered tools for academic success
Step: 2

Step: 3

Ace Your Homework with AI
Get the answers you need in no time with our AI-driven, step-by-step assistance
Get Started


