Answered step by step
Verified Expert Solution
Question
1 Approved Answer
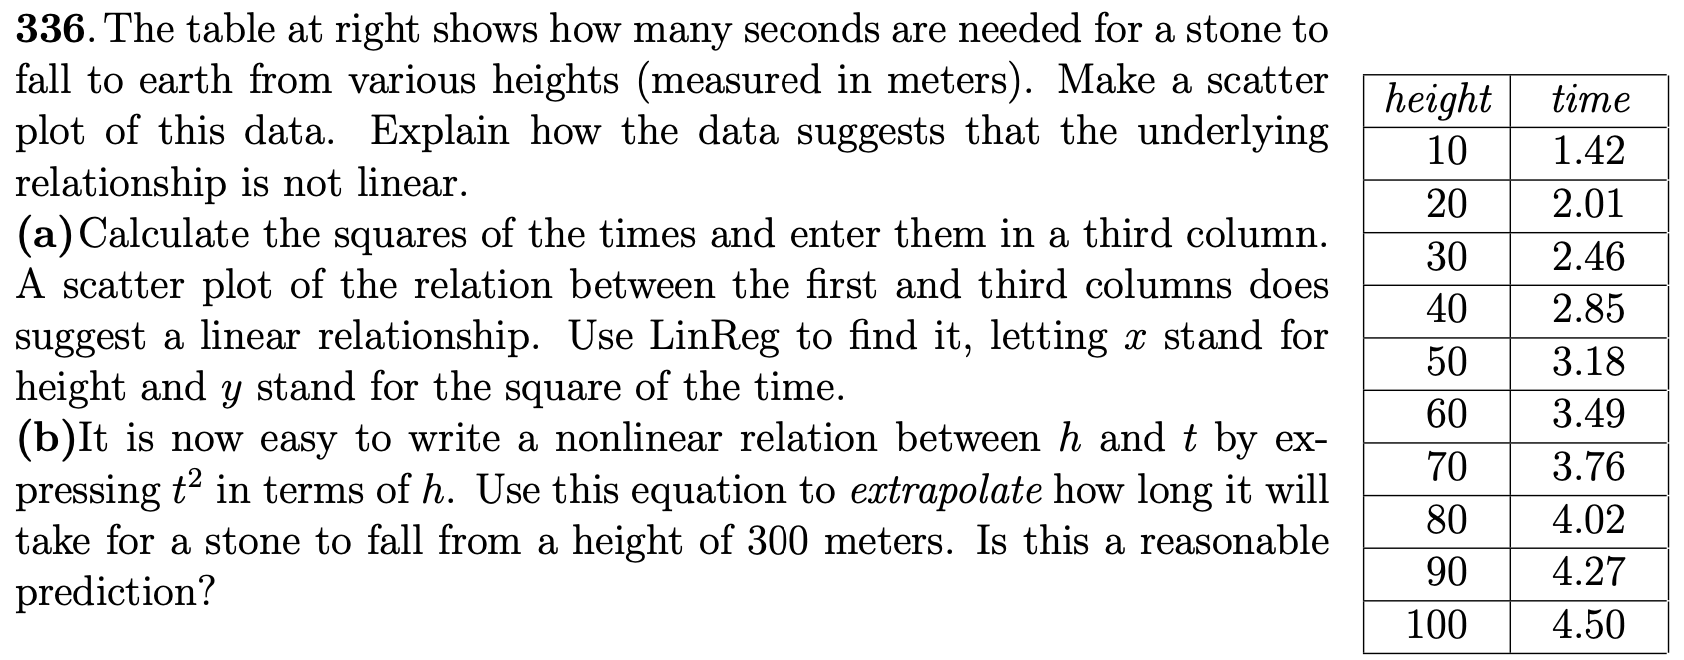
336. The table at right shows how many seconds are needed for a stone to fall to earth from various heights (measured in meters).

336. The table at right shows how many seconds are needed for a stone to fall to earth from various heights (measured in meters). Make a scatter plot of this data. Explain how the data suggests that the underlying relationship is not linear. (a) Calculate the squares of the times and enter them in a third column. A scatter plot of the relation between the first and third columns does suggest a linear relationship. Use LinReg to find it, letting stand for height and y stand for the square of the time. (b) It is now easy to write a nonlinear relation between h and t by ex- pressing t in terms of h. Use this equation to extrapolate how long it will take for a stone to fall from a height of 300 meters. Is this a reasonable prediction? height 10 20 30 40 50 60 70 80 90 100 time 1.42 2.01 2.46 2.85 3.18 3.49 3.76 4.02 4.27 4.50
Step by Step Solution
There are 3 Steps involved in it
Step: 1
The image presents a math problem that asks the student to analyze a set of data given in a table The table contains two columns heights from which a ...
Get Instant Access to Expert-Tailored Solutions
See step-by-step solutions with expert insights and AI powered tools for academic success
Step: 2

Step: 3

Ace Your Homework with AI
Get the answers you need in no time with our AI-driven, step-by-step assistance
Get Started


