

Question
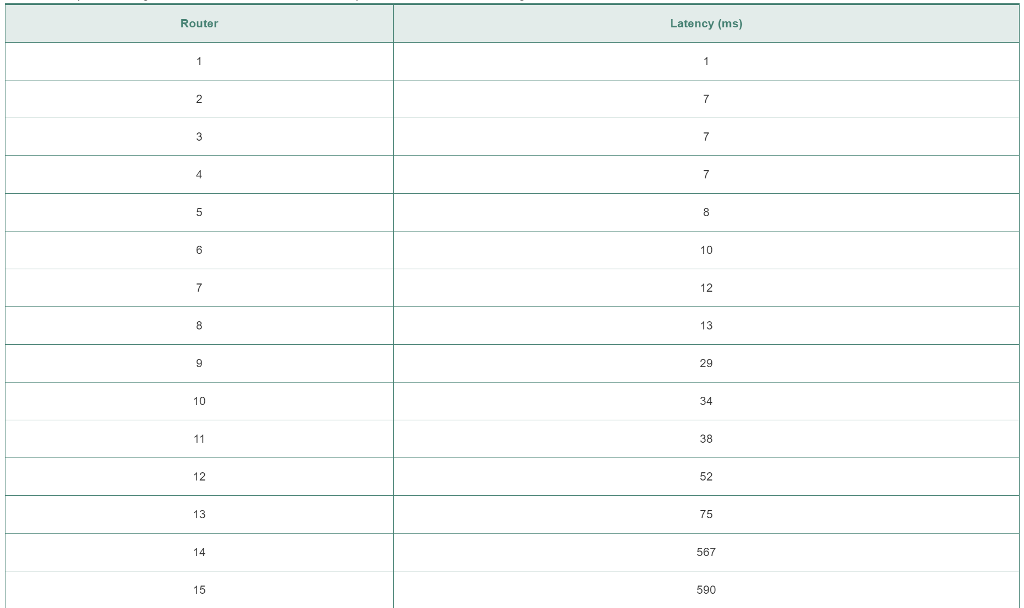
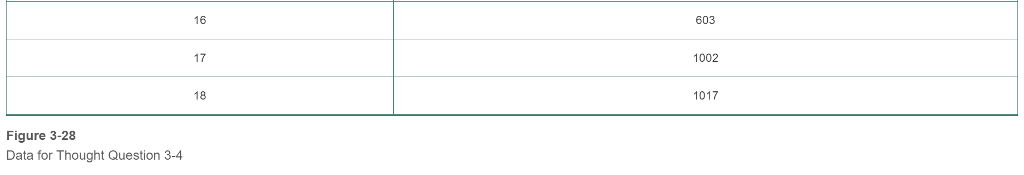
3-4. Figure 3-28 has data from a Traceroute analysis. a) Add a third column showing the change in latency between the router in that row
3-4. Figure 3-28 has data from a Traceroute analysis. a) Add a third column showing the change in latency between the router in that row and the router in the preceding row. (Check figure: The change for Router 2 from Router 3 is zero.) Shade the row for any large latency problem or problems you find. b) For the first problem you find, state whether the problem might be in the router in the row, in the previous router, or something else.
Step by Step Solution
There are 3 Steps involved in it
Step: 1

Get Instant Access to Expert-Tailored Solutions
See step-by-step solutions with expert insights and AI powered tools for academic success
Step: 2

Step: 3
Ace Your Homework with AI
Get the answers you need in no time with our AI-driven, step-by-step assistance
Get Started
Modern Database Management
Authors: Jeff Hoffer, Ramesh Venkataraman, Heikki Topi
12th edition
133544613, 978-0133544619