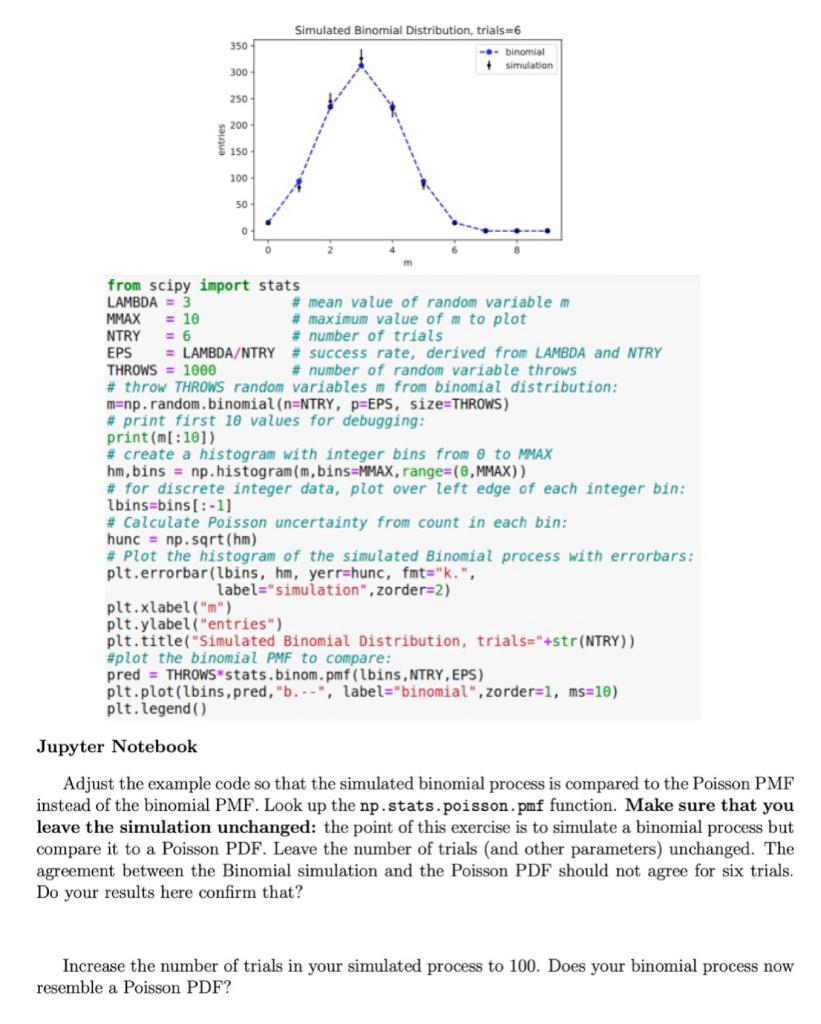
350 Simulated Binomial Distribution, trials=6 -- binomial + simulation 300 250 200 150 100 50 0 NTRY from scipy import stats LAMBDA = 3 # mean value of random variable m MMAX = 10 # maximum value of mto plot = 6 # number of trials EPS = LAMBDA/NTRY # success rate, derived from LAMBDA and NTRY THROWS = 1000 # number of random variable throws # throw THROWS random variables m from binomial distribution: m=np.random. binomial(n=NTRY, PEEPS, size=THROWS) # print first 10 values for debugging: print(m[:10]) # create a histogram with integer bins from 0 to MMAX hm, bins = np.histogram(m,bins=MMAX, range=(0,MMAX)) # for discrete integer data, plot over left edge of each integer bin: lbins=bins[:-1] # Calculate Poisson uncertainty from count in each bin: hunc = np. sqrt(hm) # Plot the histogram of the simulated Binomial process with errorbars: plt.errorbar(lbins, hm, yerrshunc, fmt="k.", label="simulation", zorder=2) plt.xlabel("m") plt.ylabel("entries") plt.title("Simulated Binomial Distribution, trials="+str(NTRY)) #plot the binomial PMF to compare: pred = THROWS stats.binom.pmf (lbins, NTRY, EPS) plt.plot(lbins,pred, "b.--", label="binomial",zorder=1, ms=10) plt. legend() Jupyter Notebook Adjust the example code so that the simulated binomial process is compared to the Poisson PMF instead of the binomial PMF. Look up the np.stats.poisson.pmf function. Make sure that you leave the simulation unchanged: the point of this exercise is to simulate a binomial process but compare it to a Poisson PDF. Leave the number of trials (and other parameters) unchanged. The agreement between the Binomial simulation and the Poisson PDF should not agree for six trials. Do your results here confirm that? Increase the number of trials in your simulated process to 100. Does your binomial process now resemble a Poisson PDF? 350 Simulated Binomial Distribution, trials=6 -- binomial + simulation 300 250 200 150 100 50 0 NTRY from scipy import stats LAMBDA = 3 # mean value of random variable m MMAX = 10 # maximum value of mto plot = 6 # number of trials EPS = LAMBDA/NTRY # success rate, derived from LAMBDA and NTRY THROWS = 1000 # number of random variable throws # throw THROWS random variables m from binomial distribution: m=np.random. binomial(n=NTRY, PEEPS, size=THROWS) # print first 10 values for debugging: print(m[:10]) # create a histogram with integer bins from 0 to MMAX hm, bins = np.histogram(m,bins=MMAX, range=(0,MMAX)) # for discrete integer data, plot over left edge of each integer bin: lbins=bins[:-1] # Calculate Poisson uncertainty from count in each bin: hunc = np. sqrt(hm) # Plot the histogram of the simulated Binomial process with errorbars: plt.errorbar(lbins, hm, yerrshunc, fmt="k.", label="simulation", zorder=2) plt.xlabel("m") plt.ylabel("entries") plt.title("Simulated Binomial Distribution, trials="+str(NTRY)) #plot the binomial PMF to compare: pred = THROWS stats.binom.pmf (lbins, NTRY, EPS) plt.plot(lbins,pred, "b.--", label="binomial",zorder=1, ms=10) plt. legend() Jupyter Notebook Adjust the example code so that the simulated binomial process is compared to the Poisson PMF instead of the binomial PMF. Look up the np.stats.poisson.pmf function. Make sure that you leave the simulation unchanged: the point of this exercise is to simulate a binomial process but compare it to a Poisson PDF. Leave the number of trials (and other parameters) unchanged. The agreement between the Binomial simulation and the Poisson PDF should not agree for six trials. Do your results here confirm that? Increase the number of trials in your simulated process to 100. Does your binomial process now resemble a Poisson PDF