Answered step by step
Verified Expert Solution
Question
1 Approved Answer
3:55 AM KAT 1 X com/courses/76519/pages/regression-project-data?module_item_id=1301479 All Artist Mp3 Song... Moviez Showroom USCIS - home W olves & Our Ecos... clicker Jps70.Ch.2. Suppose The Unite.


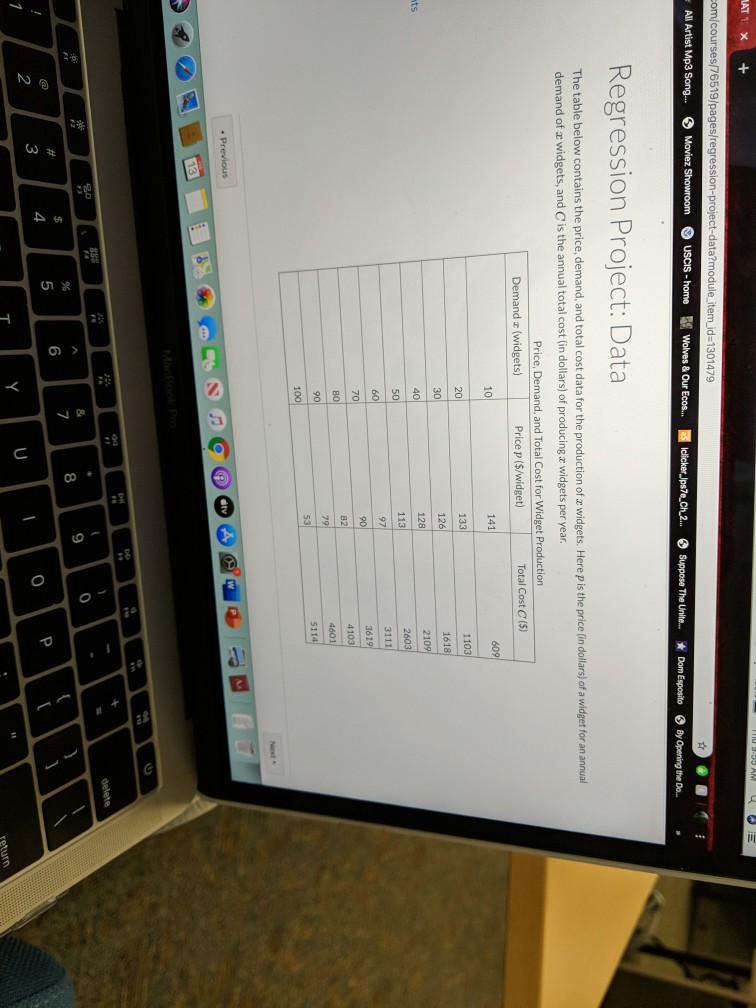
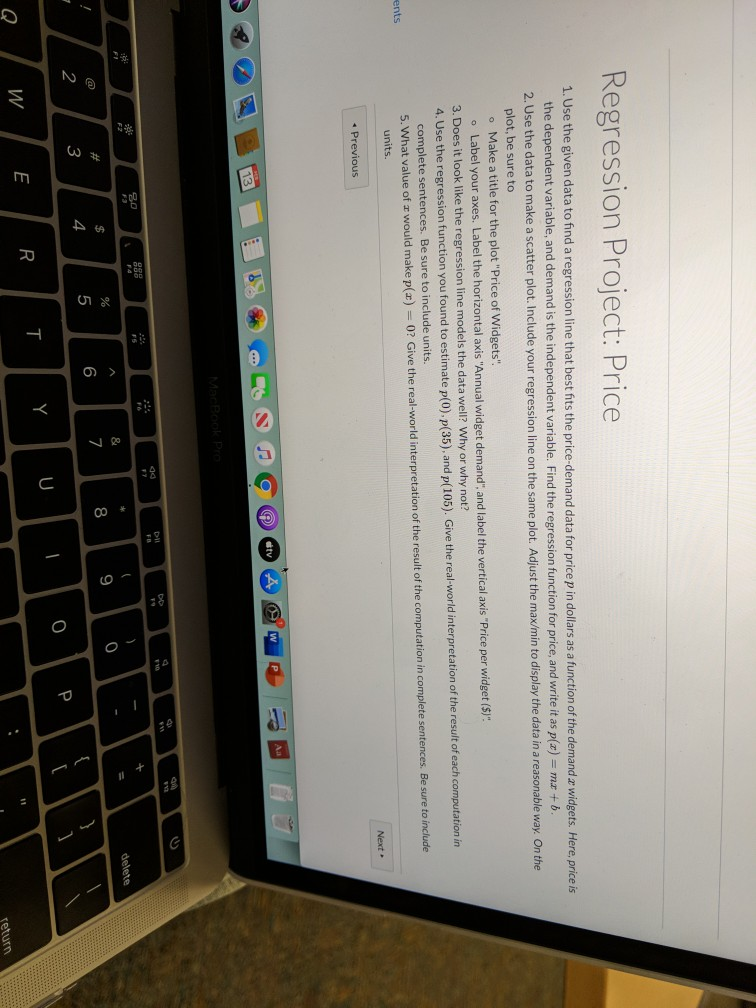
3:55 AM KAT 1 X com/courses/76519/pages/regression-project-data?module_item_id=1301479 All Artist Mp3 Song... Moviez Showroom USCIS - home W olves & Our Ecos... clicker Jps70.Ch.2. Suppose The Unite. Dom Esposito By Opening the Do Regression Project: Data The table below contains the price, demand, and total cost data for the production of a widgets. Here p is the price in dollars) of a widget for an annual demand of a widgets, and C is the annual total cost (in dollars) of producing a widgets per year. Price, Demand, and Total Cost for Widget Production Demand (widgets) Price p ($/widget) Total Cost (5) 141 609 133 126 1103 1618 2109 2603 3111 nts 3619 4103 4601 5114 Previous dete LLI I Y U10 Pli Regression Project: Price 1. Use the given data to find a regression line that best fits the price demand data for price p in dollars as a function of the demand a widgets. Here, price is the dependent variable, and demand is the independent variable. Find the regression function for price, and write it as p(x) = mx +b. 2. Use the data to make a scatter plot. Include your regression line on the same plot. Adjust the max/min to display the data in a reasonable way. On the plot, be sure to . Make a title for the plot "Price of Widgets". o Label your axes. Label the horizontal axis "Annual widget demand", and label the vertical axis "Price per widget ($)" 3. Does it look like the regression line models the data well? Why or why not? 4. Use the regression function you found to estimate p(0) p(35), and p(105). Give the real world interpretation of the result of each computation in complete sentences. Be sure to include units. 5. What value of I would make pa)=0? Give the real-world interpretation of the result of the computation in complete sentences. Be sure to include units. ents Next Previous delete or A Q / WERTYUIO P return 3:55 AM KAT 1 X com/courses/76519/pages/regression-project-data?module_item_id=1301479 All Artist Mp3 Song... Moviez Showroom USCIS - home W olves & Our Ecos... clicker Jps70.Ch.2. Suppose The Unite. Dom Esposito By Opening the Do Regression Project: Data The table below contains the price, demand, and total cost data for the production of a widgets. Here p is the price in dollars) of a widget for an annual demand of a widgets, and C is the annual total cost (in dollars) of producing a widgets per year. Price, Demand, and Total Cost for Widget Production Demand (widgets) Price p ($/widget) Total Cost (5) 141 609 133 126 1103 1618 2109 2603 3111 nts 3619 4103 4601 5114 Previous dete LLI I Y U10 Pli Regression Project: Price 1. Use the given data to find a regression line that best fits the price demand data for price p in dollars as a function of the demand a widgets. Here, price is the dependent variable, and demand is the independent variable. Find the regression function for price, and write it as p(x) = mx +b. 2. Use the data to make a scatter plot. Include your regression line on the same plot. Adjust the max/min to display the data in a reasonable way. On the plot, be sure to . Make a title for the plot "Price of Widgets". o Label your axes. Label the horizontal axis "Annual widget demand", and label the vertical axis "Price per widget ($)" 3. Does it look like the regression line models the data well? Why or why not? 4. Use the regression function you found to estimate p(0) p(35), and p(105). Give the real world interpretation of the result of each computation in complete sentences. Be sure to include units. 5. What value of I would make pa)=0? Give the real-world interpretation of the result of the computation in complete sentences. Be sure to include units. ents Next Previous delete or A Q / WERTYUIO P return
Step by Step Solution
There are 3 Steps involved in it
Step: 1

Get Instant Access to Expert-Tailored Solutions
See step-by-step solutions with expert insights and AI powered tools for academic success
Step: 2

Step: 3

Ace Your Homework with AI
Get the answers you need in no time with our AI-driven, step-by-step assistance
Get Started


