Question
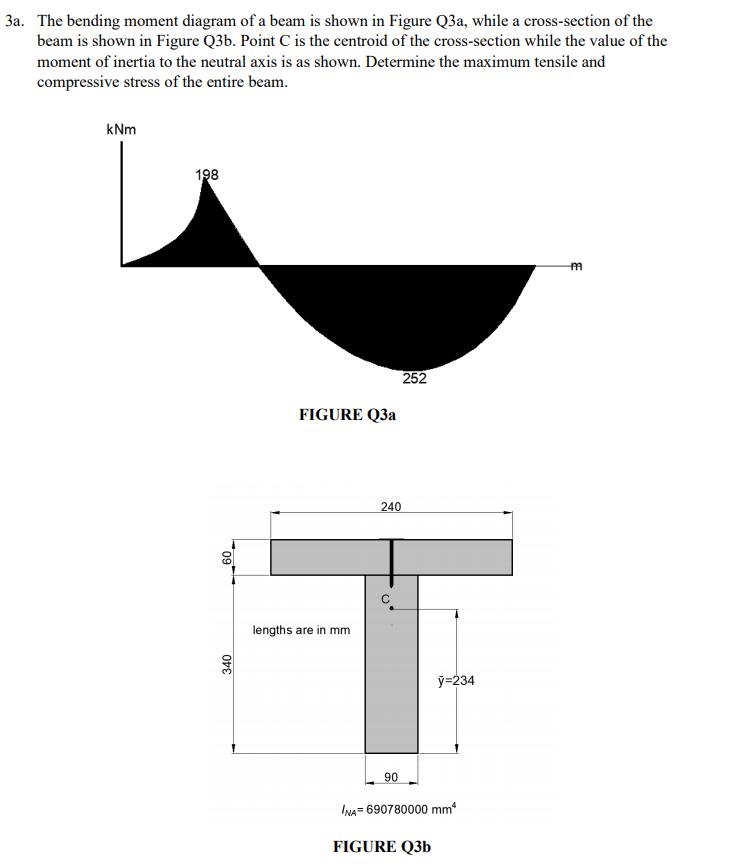
3a. The bending moment diagram of a beam is shown in Figure Q3a, while a cross-section of the beam is shown in Figure Q3b.
3a. The bending moment diagram of a beam is shown in Figure Q3a, while a cross-section of the beam is shown in Figure Q3b. Point C is the centroid of the cross-section while the value of the moment of inertia to the neutral axis is as shown. Determine the maximum tensile and compressive stress of the entire beam. kNm 198 m 252 FIGURE Q3a 240 lengths are in mm =234 90 INA= 690780000 mm FIGURE Q3b 09
Step by Step Solution
3.48 Rating (158 Votes )
There are 3 Steps involved in it
Step: 1
To determine the value of Maximum tensile maximum compressive stress we will use following equation ...
Get Instant Access to Expert-Tailored Solutions
See step-by-step solutions with expert insights and AI powered tools for academic success
Step: 2

Step: 3

Ace Your Homework with AI
Get the answers you need in no time with our AI-driven, step-by-step assistance
Get StartedRecommended Textbook for
Control Systems Engineering
Authors: Norman S. Nise
7th Edition
1118170512, 978-1118170519
Students also viewed these Civil Engineering questions
Question
Answered: 1 week ago
Question
Answered: 1 week ago
Question
Answered: 1 week ago
Question
Answered: 1 week ago
Question
Answered: 1 week ago
Question
Answered: 1 week ago
Question
Answered: 1 week ago
Question
Answered: 1 week ago
Question
Answered: 1 week ago
Question
Answered: 1 week ago
Question
Answered: 1 week ago
Question
Answered: 1 week ago
Question
Answered: 1 week ago
Question
Answered: 1 week ago
Question
Answered: 1 week ago
Question
Answered: 1 week ago
Question
Answered: 1 week ago
Question
Answered: 1 week ago
Question
Answered: 1 week ago
Question
Answered: 1 week ago
View Answer in SolutionInn App


