

Question
3a) What amount of internally-generated funds would be available for the retirement of the loan? 3b)If the bank were to grant the additional credit and
3a) What amount of internally-generated funds would be available for the retirement of the loan?
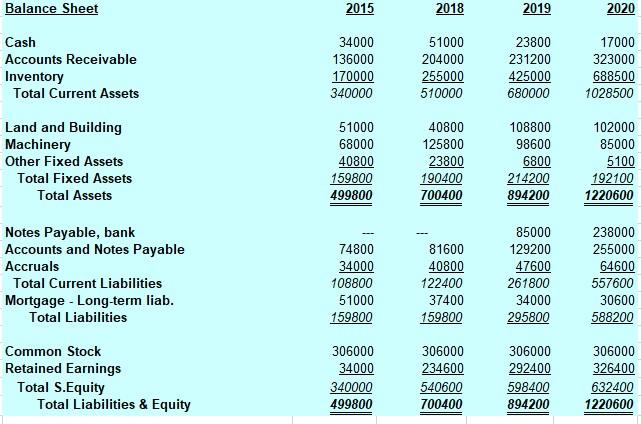
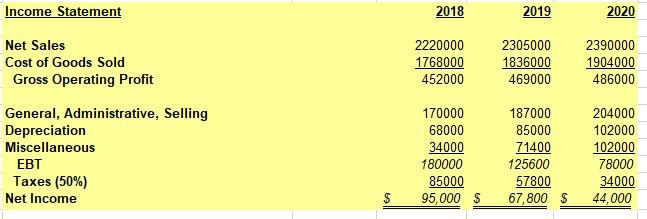
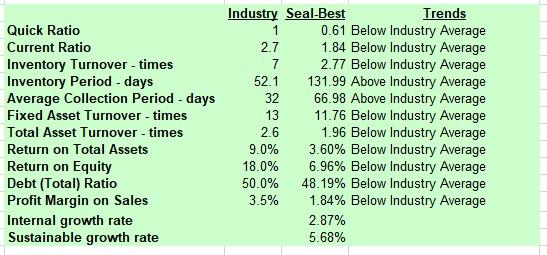
3b)If the bank were to grant the additional credit and extend the increased loan from a due date of February 1 to June 30, would the company be able to retire the loan on June 30? (Hint: To answer this question, consider profits and depreciation as well as the amount of inventories and receivables that would be carried if Seal-best's inventory turnover and average collection period (Days Sales Outstanding) were at industry average levels, that is, generating funds by reducing inventories and receivables to industry averages.)
Balance Sheet 2015 2018 2019 2020 Cash Accounts Receivable Inventory Total Current Assets 34000 136000 170000 340000 51000 204000 255000 510000 23800 231200 425000 680000 17000 323000 688500 1028500 Land and Building Machinery Other Fixed Assets Total Fixed Assets Total Assets 51000 68000 40800 159800 499800 40800 125800 23800 190400 700400 108800 98600 6800 214200 894200 102000 85000 5100 192100 1220600 Notes Payable, bank Accounts and Notes Payable Accruals Total Current Liabilities Mortgage - Long-term liab. Total Liabilities 74800 34000 108800 51000 159800 81600 40800 122400 37400 159800 85000 129200 47600 261800 34000 295800 238000 255000 64600 557600 30600 588200 Common Stock Retained Earnings Total S.Equity Total Liabilities & Equity 306000 34000 340000 499800 306000 234600 540600 700400 306000 292400 598400 894200 306000 326400 632400 1220600 Income Statement 2018 2019 2020 2220000 1768000 452000 2305000 1836000 469000 2390000 1904000 486000 Net Sales Cost of Goods Sold Gross Operating Profit General, Administrative, Selling Depreciation Miscellaneous EBT Taxes (50%) Net Income 170000 68000 34000 180000 85000 95,000 $ 187000 85000 71400 125600 57800 67,800 $ 204000 102000 102000 78000 34000 44,000 $ II Quick Ratio Current Ratio Inventory Turnover - times Inventory Period - days Average Collection Period - days Fixed Asset Turnover - times Total Asset Turnover - times Return on Total Assets Return on Equity Debt (Total) Ratio Profit Margin on Sales Internal growth rate Sustainable growth rate Industry Seal-Best Trends 1 0.61 Below Industry Average 2.7 1.84 Below Industry Average 7 2.77 Below Industry Average 52.1 131.99 Above Industry Average 32 66.98 Above Industry Average 13 11.76 Below Industry Average 2.6 1.96 Below Industry Average 9.0% 3.60% Below Industry Average 18.0% 6.96% Below Industry Average 50.0% 48.19% Below Industry Average 3.5% 1.84% Below Industry Average 2.87% 5.68% Balance Sheet 2015 2018 2019 2020 Cash Accounts Receivable Inventory Total Current Assets 34000 136000 170000 340000 51000 204000 255000 510000 23800 231200 425000 680000 17000 323000 688500 1028500 Land and Building Machinery Other Fixed Assets Total Fixed Assets Total Assets 51000 68000 40800 159800 499800 40800 125800 23800 190400 700400 108800 98600 6800 214200 894200 102000 85000 5100 192100 1220600 Notes Payable, bank Accounts and Notes Payable Accruals Total Current Liabilities Mortgage - Long-term liab. Total Liabilities 74800 34000 108800 51000 159800 81600 40800 122400 37400 159800 85000 129200 47600 261800 34000 295800 238000 255000 64600 557600 30600 588200 Common Stock Retained Earnings Total S.Equity Total Liabilities & Equity 306000 34000 340000 499800 306000 234600 540600 700400 306000 292400 598400 894200 306000 326400 632400 1220600 Income Statement 2018 2019 2020 2220000 1768000 452000 2305000 1836000 469000 2390000 1904000 486000 Net Sales Cost of Goods Sold Gross Operating Profit General, Administrative, Selling Depreciation Miscellaneous EBT Taxes (50%) Net Income 170000 68000 34000 180000 85000 95,000 $ 187000 85000 71400 125600 57800 67,800 $ 204000 102000 102000 78000 34000 44,000 $ II Quick Ratio Current Ratio Inventory Turnover - times Inventory Period - days Average Collection Period - days Fixed Asset Turnover - times Total Asset Turnover - times Return on Total Assets Return on Equity Debt (Total) Ratio Profit Margin on Sales Internal growth rate Sustainable growth rate Industry Seal-Best Trends 1 0.61 Below Industry Average 2.7 1.84 Below Industry Average 7 2.77 Below Industry Average 52.1 131.99 Above Industry Average 32 66.98 Above Industry Average 13 11.76 Below Industry Average 2.6 1.96 Below Industry Average 9.0% 3.60% Below Industry Average 18.0% 6.96% Below Industry Average 50.0% 48.19% Below Industry Average 3.5% 1.84% Below Industry Average 2.87% 5.68%
Step by Step Solution
There are 3 Steps involved in it
Step: 1

Get Instant Access to Expert-Tailored Solutions
See step-by-step solutions with expert insights and AI powered tools for academic success
Step: 2

Step: 3
Ace Your Homework with AI
Get the answers you need in no time with our AI-driven, step-by-step assistance
Get Started
Options Futures And Other Derivatives
Authors: John Hull
9th Global Edition
1292212896, 9781292212890