Answered step by step
Verified Expert Solution
Question
1 Approved Answer
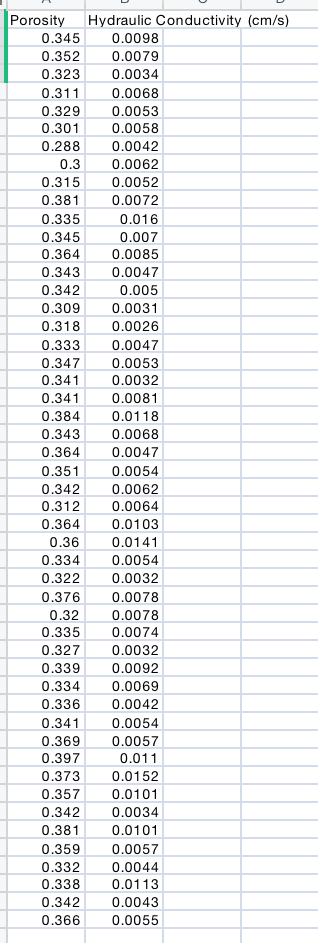
3A.Perform a simple linear regression between porosity and hydraulic conductivity (you're your transform variable(s) as appropriate). Identify your dependent (Y) and independent (X) variables. Report
3A.Perform a simple linear regression between porosity and hydraulic conductivity (you're your transform variable(s) as appropriate). Identify your dependent (Y) and independent (X) variables. Report your regression equation.
B. Test for significance of the regression in step 3 by checking whether or not the slope coefficient is statistically significant. Report the results of your significance test and interpret.
C. Report your R2 value. What does this tell you about how much of the variance in Y is explained by X?
DATA:

Step by Step Solution
There are 3 Steps involved in it
Step: 1

Get Instant Access to Expert-Tailored Solutions
See step-by-step solutions with expert insights and AI powered tools for academic success
Step: 2

Step: 3

Ace Your Homework with AI
Get the answers you need in no time with our AI-driven, step-by-step assistance
Get Started


