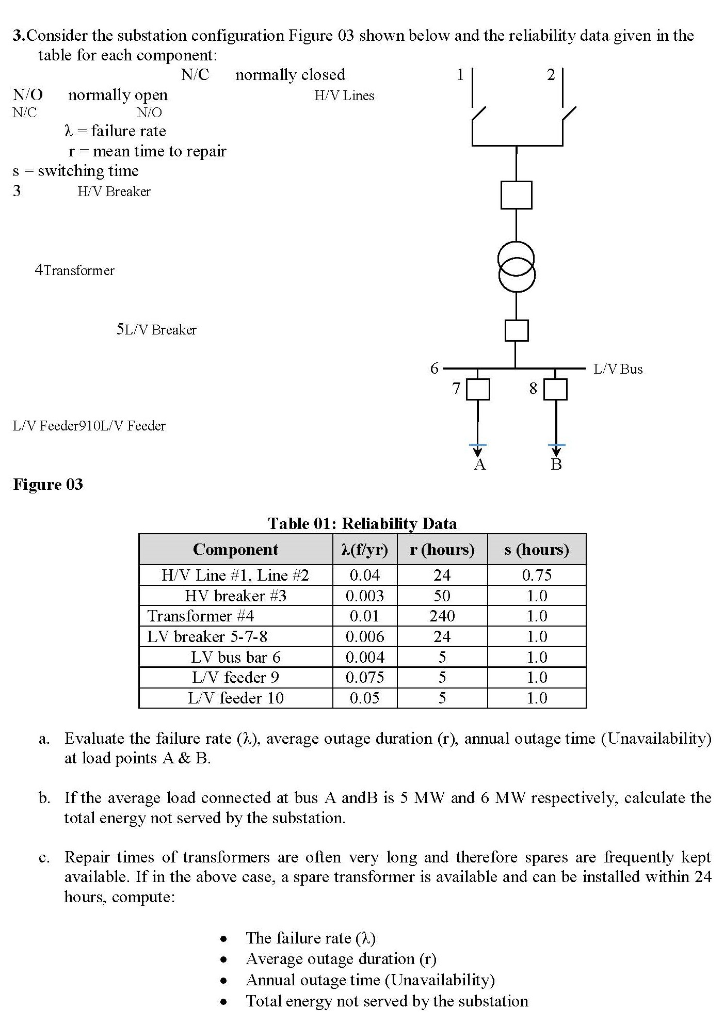
3.Consider the substation configuration Figure 03 shown below and the reliability data given in the table for each component: N/ C nornally closed NO normally open H/V Lines NIC NO 2. = failure rate r-mean time to repair s-switching time 3 H/V Breaker 4 Transformer SL/V Breaker LIV Bus LIV Feeder910L/V Feeder Figure 03 Table 01: Reliability Data Component 2.(f/yr) r(hours) H/V Line #1. Line #2 0.04 24 HV breaker #3 0.003 50 Transformer #4 0.01 240 LV breaker 5-7-8 0.006 LV bus bar 6 0.004 L/V feeder 9 0.075 L V feeder 10 0.05 5 s (hours) 0.75 1.0 1.0 1.0 1.0 1.0 T 1.0 a. Evaluate the failure rate (), average outage duration (r), annual outage time (Unavailability) at load points A & B. b. If the average load connected at bus A and B is 5 MW and 6 MW respectively, calculate the total energy not served by the substation. c. Repair times of transformers are often very long and therefore spares are frequently kept available. If in the above case, a spare transformer is available and can be installed within 24 hours, compute: The failure rate (2) Average outage duration (1) Annual outage time (Unavailability) Total energy not served by the substation 3.Consider the substation configuration Figure 03 shown below and the reliability data given in the table for each component: N/ C nornally closed NO normally open H/V Lines NIC NO 2. = failure rate r-mean time to repair s-switching time 3 H/V Breaker 4 Transformer SL/V Breaker LIV Bus LIV Feeder910L/V Feeder Figure 03 Table 01: Reliability Data Component 2.(f/yr) r(hours) H/V Line #1. Line #2 0.04 24 HV breaker #3 0.003 50 Transformer #4 0.01 240 LV breaker 5-7-8 0.006 LV bus bar 6 0.004 L/V feeder 9 0.075 L V feeder 10 0.05 5 s (hours) 0.75 1.0 1.0 1.0 1.0 1.0 T 1.0 a. Evaluate the failure rate (), average outage duration (r), annual outage time (Unavailability) at load points A & B. b. If the average load connected at bus A and B is 5 MW and 6 MW respectively, calculate the total energy not served by the substation. c. Repair times of transformers are often very long and therefore spares are frequently kept available. If in the above case, a spare transformer is available and can be installed within 24 hours, compute: The failure rate (2) Average outage duration (1) Annual outage time (Unavailability) Total energy not served by the substation


