

Answered step by step
Verified Expert Solution
Question
1 Approved Answer
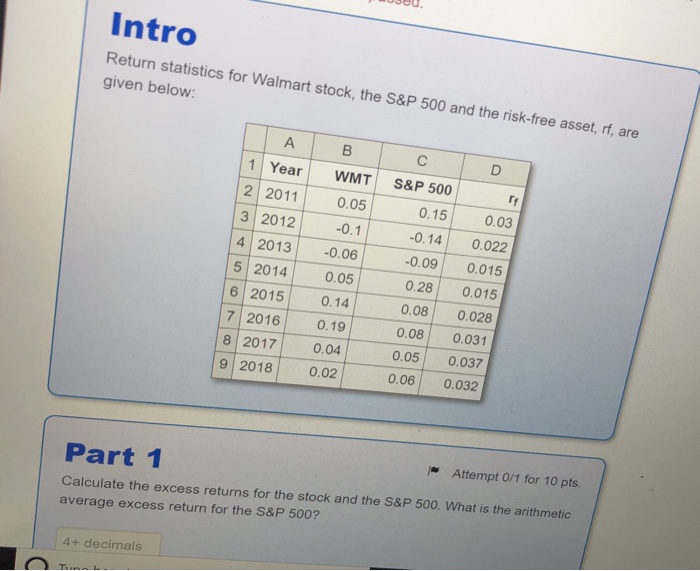
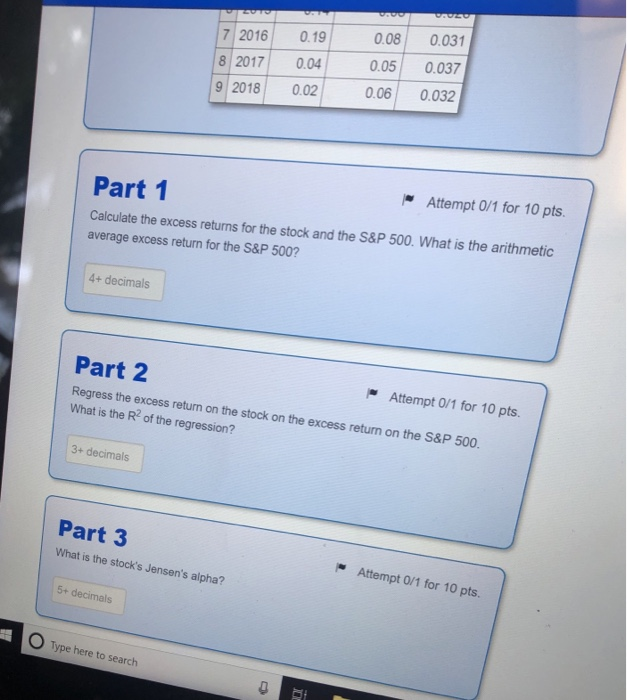
3ed Intro Return statistics for Walmart stock, the S8P 500 and the risk-free asset, f, are given below: 1 Year WMT S&P 500 2 2011
Step by Step Solution
There are 3 Steps involved in it
Step: 1

Get Instant Access to Expert-Tailored Solutions
See step-by-step solutions with expert insights and AI powered tools for academic success
Step: 2

Step: 3
Ace Your Homework with AI
Get the answers you need in no time with our AI-driven, step-by-step assistance
Get Started
Create Wealth How You Can Ditch The 9 5 Job With Multifamily Investing
Authors: Pam Scamardo
1st Edition
979-8986637709