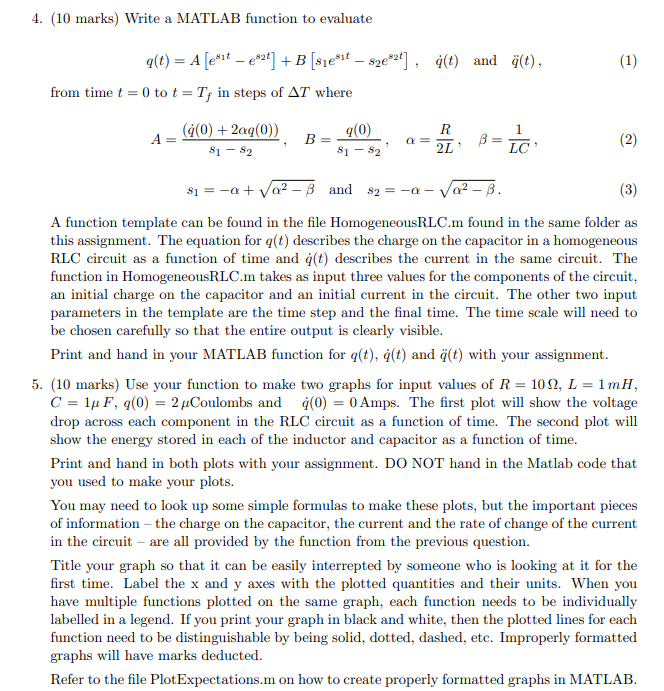
4. (10 marks) Write a MATLAB function to evaluate q(t) = A (281t 2824] + B [s1e81t 52e82t], it) and t), from time t = 0 to t =T; in steps of AT where A = (g(0) + 2aq(0), B = 9(0), a = b = c Si - S2 81 = -a + a2 - 8 and $2 = -a- Va- B. A function template can be found in the file HomogeneousRLC.m found in the same folder as this assignment. The equation for g(t) describes the charge on the capacitor in a homogeneous RLC circuit as a function of time and g(t) describes the current in the same circuit. The function in Homogeneous RLC.m takes as input three values for the components of the circuit, an initial charge on the capacitor and an initial current in the circuit. The other two input parameters in the template are the time step and the final time. The time scale will need to be chosen carefully so that the entire output is clearly visible. Print and hand in your MATLAB function for q(t), i(t) and (t) with your assignment. 5. (10 marks) Use your function to make two graphs for input values of R = 102, L = 1 mH, C = 1 F, 9(0) = 2 Coulombs and (0) = 0 Amps. The first plot will show the voltage drop across each component in the RLC circuit as a function of time. The second plot will show the energy stored in each of the inductor and capacitor as a function of time. Print and hand in both plots with your assignment. DO NOT hand in the Matlab code that you used to make your plots. You may need to look up some simple formulas to make these plots, but the important pieces of information - the charge on the capacitor, the current and the rate of change of the current in the circuit - are all provided by the function from the previous question. Title your graph so that it can be easily interrepted by someone who is looking at it for the first time. Label the x and y axes with the plotted quantities and their units. When you have multiple functions plotted on the same graph, each function needs to be individually function need to be distinguishable by being solid, dotted, dashed, etc. Improperly formatted graphs will have marks deducted. Refer to the file Plot Expectations.m on how to create properly formatted graphs in MATLAB


