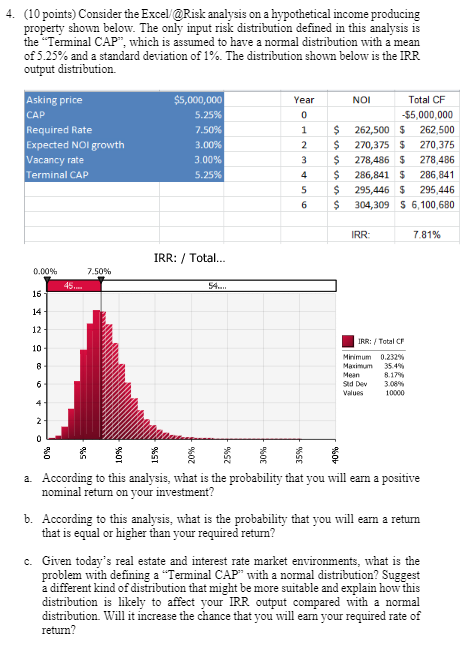
4. (10 points) Consider the Excel @Risk analysis on a hypothetical income producing property shown below. The only input risk distribution defined in this analysis is the "Terminal CAP", which is assumed to have a normal distribution with a mean of 5.25% and a standard deviation of 1%. The distribution shown below is the IRR output distribution Year 0 Asking price CAP Required Rate Expected Nol growth Vacancy rate Terminal CAP $5,000,000 5.25% 7.50% 3.00% 3.00% 5.25% 1 2 3 NOI Total CF -$5,000,000 $ 262,500 $ 262,500 $ 270,375 5 270,375 $ 278,486 5 278 486 $ 286,841 5 286,841 $ 295,446 5 295,446 $ 304,309 S 6,100,680 4 5 6 IRR: 7.81% IRR: / Total... 0.00% 7.50% 45. 54.... 16 14 12 10 IRR: / Total Minimum 0.232% Maximum 35.4% Mean 8.17% Sid Dev 3.08% Values 10000 6 2 0 0% 5% 10% 15% a. According to this analysis, what is the probability that you will earn a positive nominal return on your investment? b. According to this analysis, what is the probability that you will earn a return that is equal or higher than your required retur? c. Given today's real estate and interest rate market environments, what is the problem with defining a "Terminal CAP with a normal distribution? Suggest a different kind of distribution that might be more suitable and explain how this distribution is likely to affect your IRR output compared with a normal distribution Will it increase the chance that you will earn your required rate of return? 4. (10 points) Consider the Excel @Risk analysis on a hypothetical income producing property shown below. The only input risk distribution defined in this analysis is the "Terminal CAP", which is assumed to have a normal distribution with a mean of 5.25% and a standard deviation of 1%. The distribution shown below is the IRR output distribution Year 0 Asking price CAP Required Rate Expected Nol growth Vacancy rate Terminal CAP $5,000,000 5.25% 7.50% 3.00% 3.00% 5.25% 1 2 3 NOI Total CF -$5,000,000 $ 262,500 $ 262,500 $ 270,375 5 270,375 $ 278,486 5 278 486 $ 286,841 5 286,841 $ 295,446 5 295,446 $ 304,309 S 6,100,680 4 5 6 IRR: 7.81% IRR: / Total... 0.00% 7.50% 45. 54.... 16 14 12 10 IRR: / Total Minimum 0.232% Maximum 35.4% Mean 8.17% Sid Dev 3.08% Values 10000 6 2 0 0% 5% 10% 15% a. According to this analysis, what is the probability that you will earn a positive nominal return on your investment? b. According to this analysis, what is the probability that you will earn a return that is equal or higher than your required retur? c. Given today's real estate and interest rate market environments, what is the problem with defining a "Terminal CAP with a normal distribution? Suggest a different kind of distribution that might be more suitable and explain how this distribution is likely to affect your IRR output compared with a normal distribution Will it increase the chance that you will earn your required rate of return