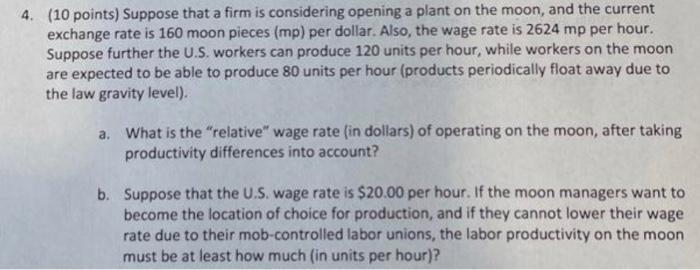
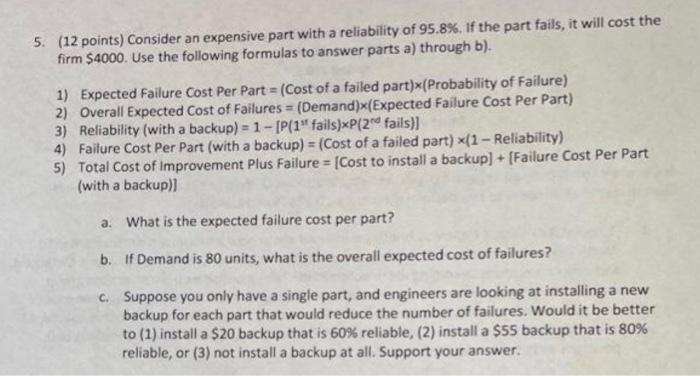
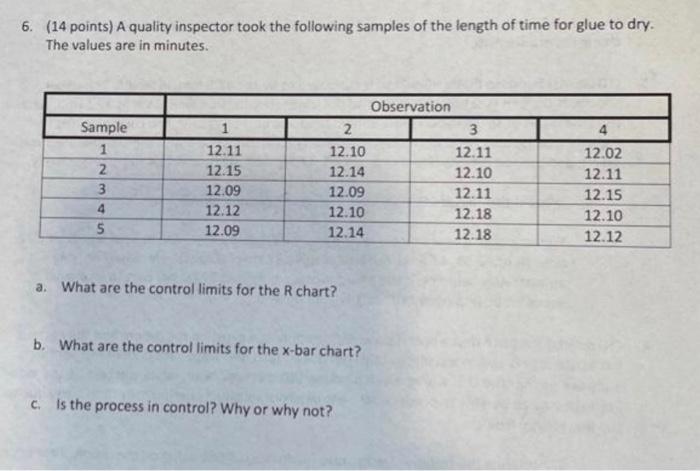
4. (10 points) Suppose that a firm is considering opening a plant on the moon, and the current exchange rate is 160 moon pieces (mp ) per dollar. Also, the wage rate is 2624mp per hour. Suppose further the U.S. workers can produce 120 units per hour, while workers on the moon are expected to be able to produce 80 units per hour (products periodically float away due to the law gravity level). a. What is the "relative" wage rate (in dollars) of operating on the moon, after taking productivity differences into account? b. Suppose that the U.S. wage rate is $20.00 per hour. If the moon managers want to become the location of choice for production, and if they cannot lower their wage rate due to their mob-controlled labor unions, the labor productivity on the moon must be at least how much (in units per hour)? 5. (12 points) Consider an expensive part with a reliability of 95.8%. If the part fails, it will cost the firm $4000. Use the following formulas to answer parts a) through b). 1) Expected Failure Cost Per Part = (Cost of a failed part) (Probability of Failure) 2) Overall Expected Cost of Failures =( Demand )( Expected Failure Cost Per Part) 3) Reliability (with a backup) =1[P(111 fails )P(2res fails )] 4) Failure Cost Per Part (with a backup) =( Cost of a failed part )(1 - Reliability) 5) Total Cost of Improvement Plus Failure =[ Cost to install a backup] + [Failure Cost Per Part (with a backup)] a. What is the expected failure cost per part? b. If Demand is 80 units, what is the overall expected cost of failures? c. Suppose you only have a single part, and engineers are looking at installing a new backup for each part that would reduce the number of failures. Would it be better to (1) install a $20 backup that is 60% reliable, (2) install a $55 backup that is 80% reliable, or (3) not install a backup at all. Support your answer. 6. (14 points) A quality inspector took the following samples of the length of time for glue to dry. The values are in minutes. a. What are the control limits for the R chart? b. What are the control limits for the x-bar chart? c. Is the process in control? Why or why not


