Answered step by step
Verified Expert Solution
Question
1 Approved Answer
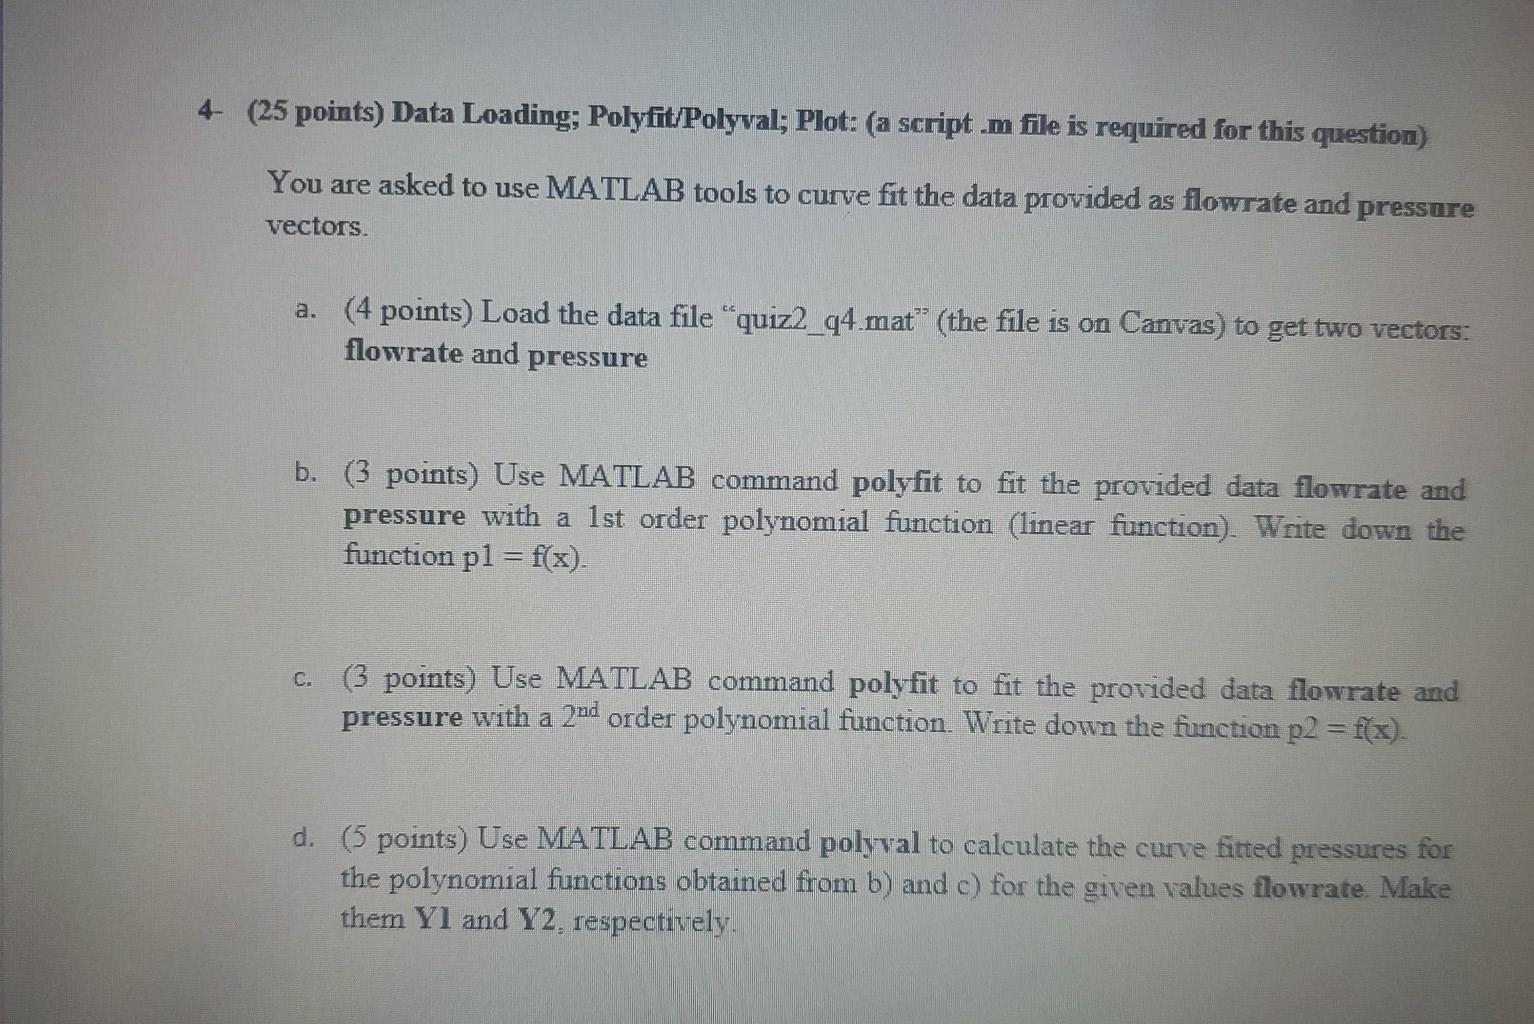
4- (25 points) Data Loading; Polyfit/Polyval; Plot: (a script.m file is required for this question) You are asked to use MATLAB tools to curve fit


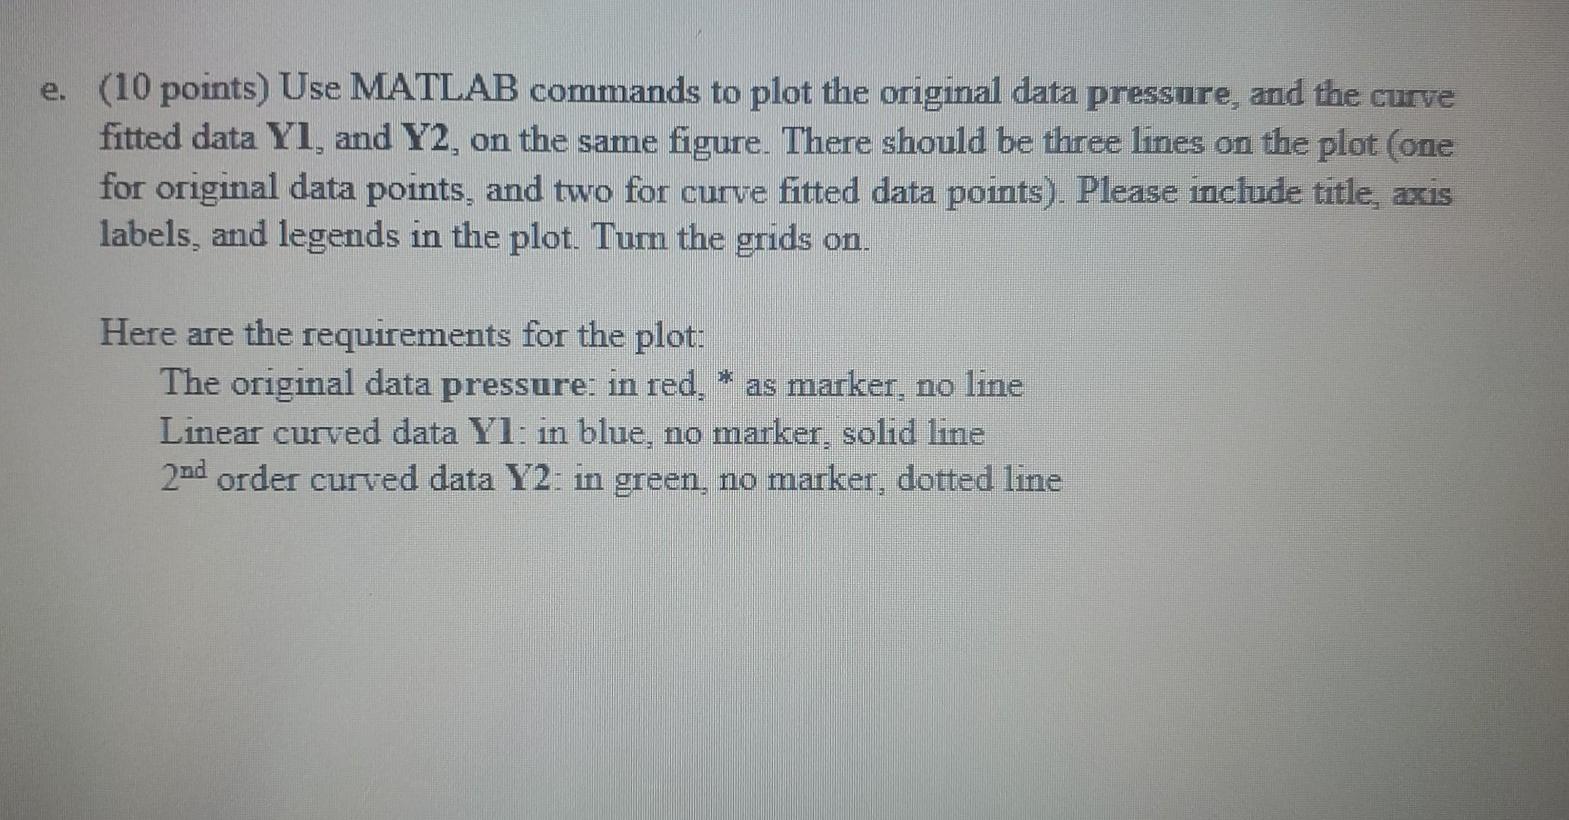
4- (25 points) Data Loading; Polyfit/Polyval; Plot: (a script.m file is required for this question) You are asked to use MATLAB tools to curve fit the data provided as flowrate and pressure Vectors a. (4 points) Load the data file "quiz2_q4.mat" (the file is on Canvas) to get two vectors: flowrate and pressure b. (3 points) Use MATLAB command polyfit to fit the provided data flowrate and pressure with a 1st order polynomial function (linear function). Write down the function pl = f(x). (3 points) Use MATLAB command polyfit to fit the provided data flowrate and pressure with a 20d order polynomial function. Write down the function p2 = f(x). d. (5 points) Use MATLAB command polyval to calculate the curve fitted pressures for the polynomial functions obtained from b) and c) for the given values flowrate. Make them Yl and Y2 respectively. e. (10 points) Use MATLAB commands to plot the original data pressure, and the curve fitted data Yl, and Y2, on the same figure. There should be three lines on the plot (one for original data points, and two for curve fitted data points). Please include title, axis labels, and legends in the plot. Turn the grids on. Here are the requirements for the plot: The original data pressure: in red, as marker, no line Linear curved data Yl: in blue, no marker, solid line 2nd order curved data Y2: in green, no marker, dotted line
Step by Step Solution
There are 3 Steps involved in it
Step: 1

Get Instant Access to Expert-Tailored Solutions
See step-by-step solutions with expert insights and AI powered tools for academic success
Step: 2

Step: 3

Ace Your Homework with AI
Get the answers you need in no time with our AI-driven, step-by-step assistance
Get Started


