Question: 4 3.10 LAB: One-sample hypothesis test for population proportion The gpa dataset is a toy dataset containing the features height and gpa for 35


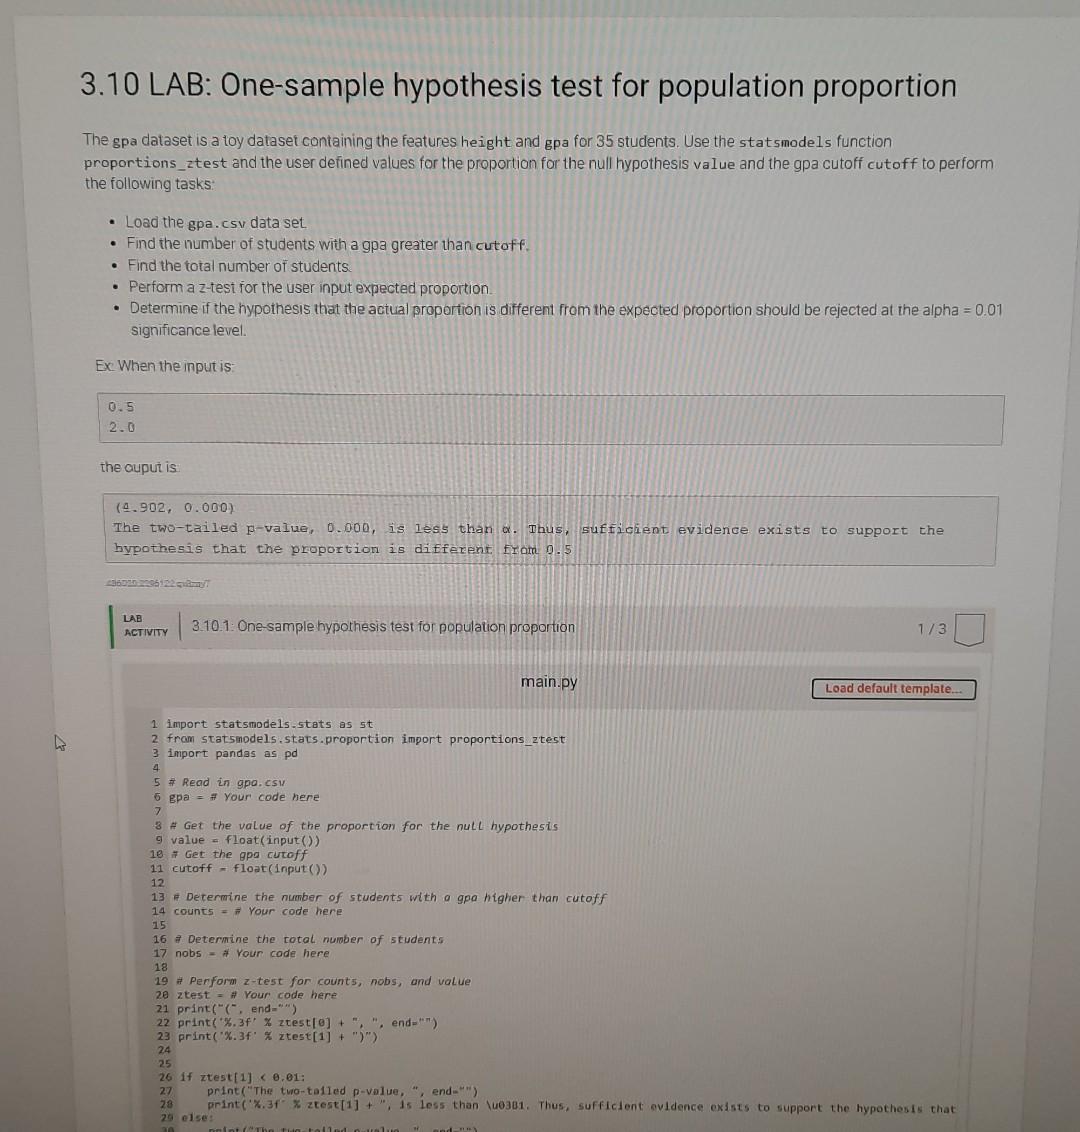
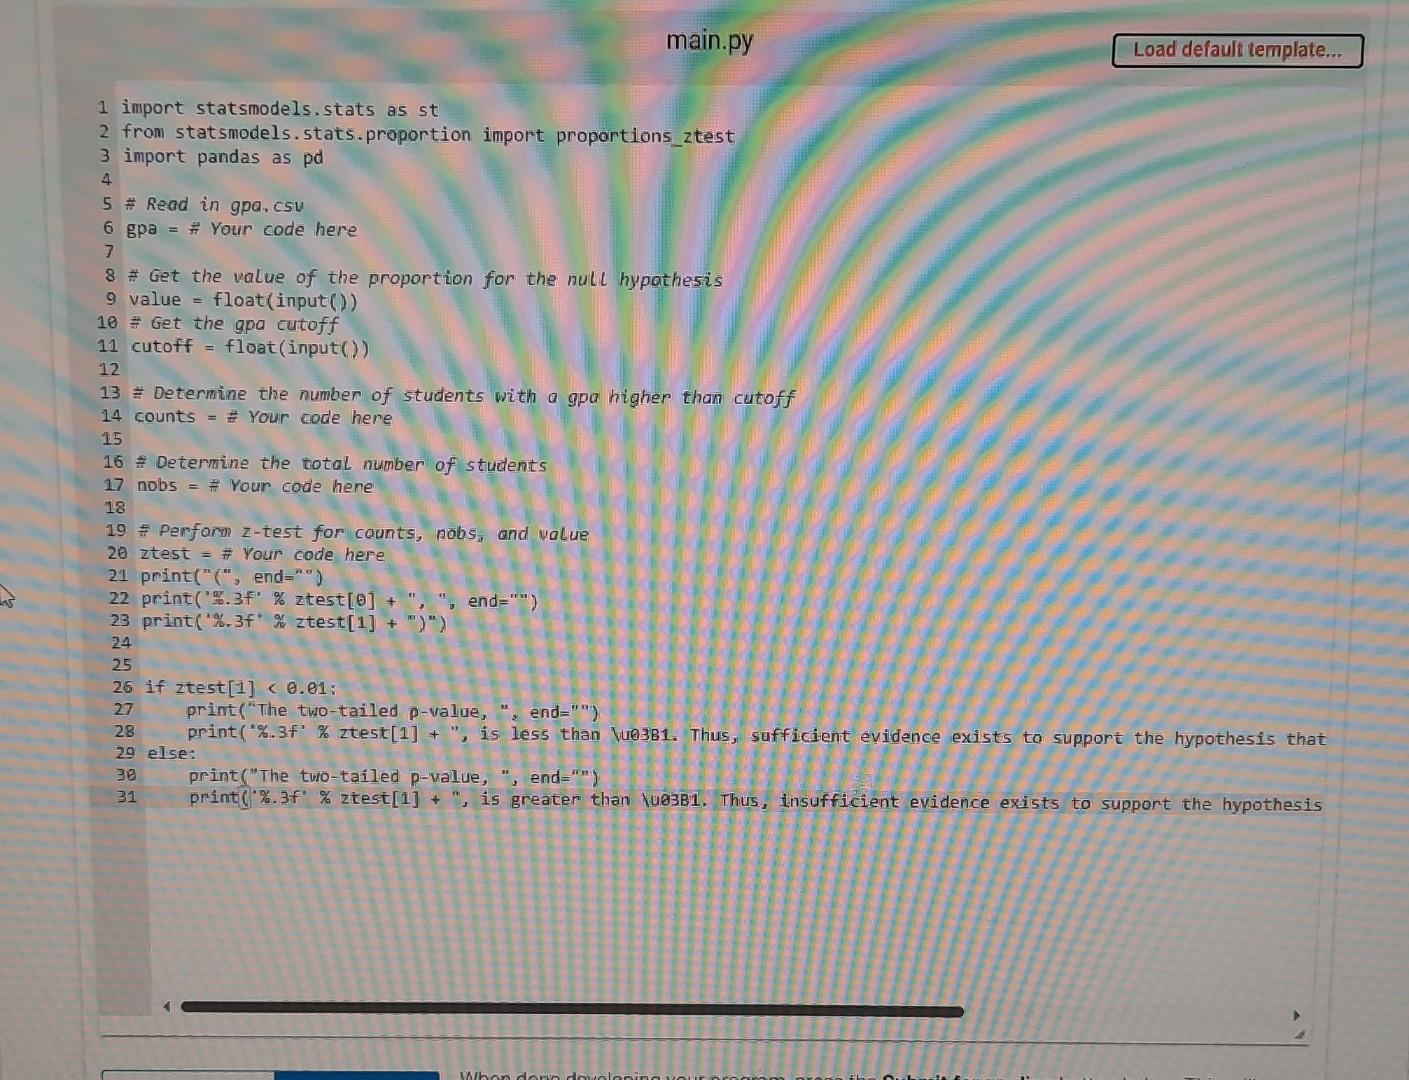
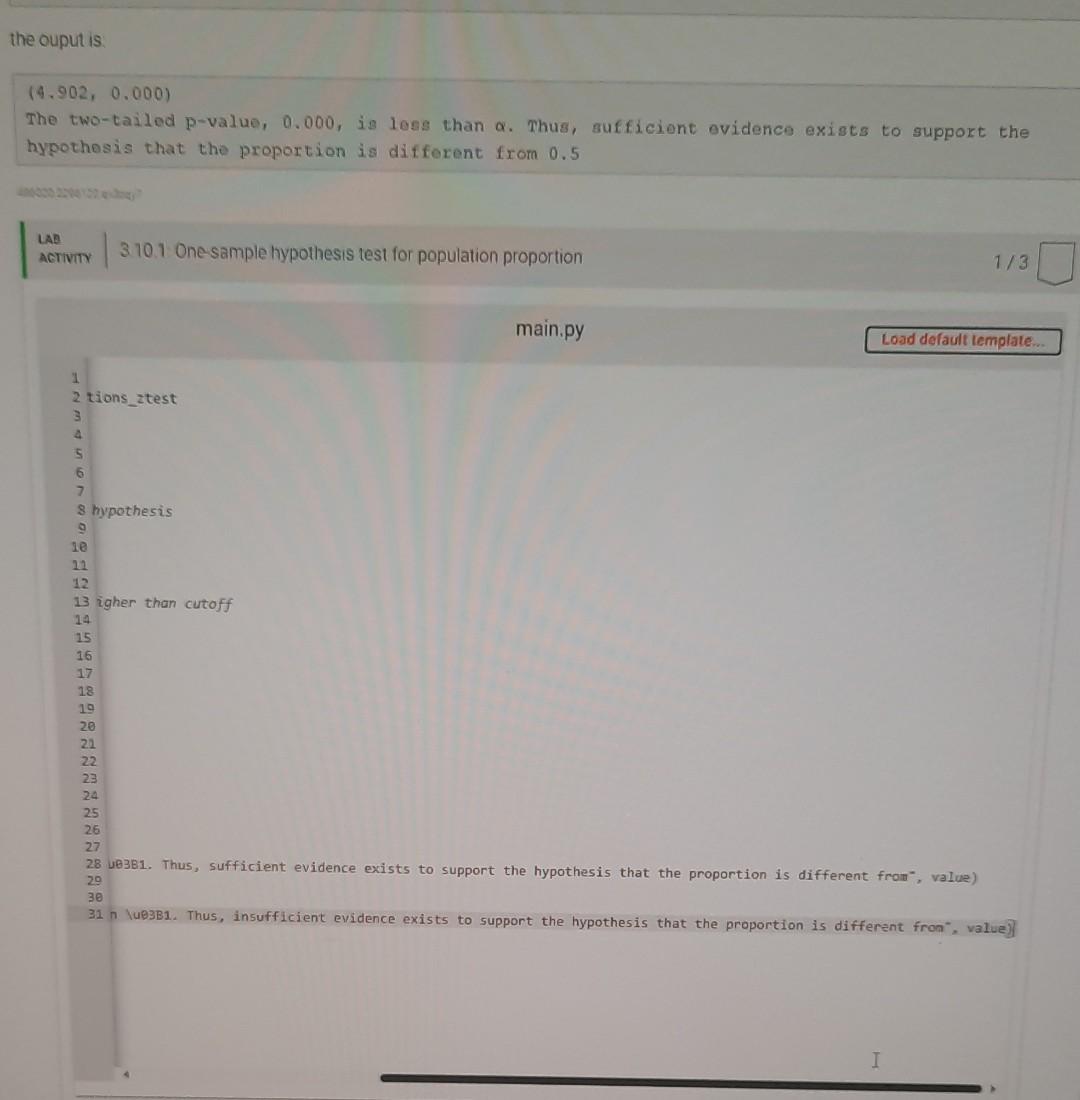
4 3.10 LAB: One-sample hypothesis test for population proportion The gpa dataset is a toy dataset containing the features height and gpa for 35 students. Use the statsmodels function proportions_ztest and the user defined values for the proportion for the null hypothesis value and the gpa cutoff cutoff to perform the following tasks: Load the gpa.csv data set. Find the number of students with a gpa greater than cutoff. . Find the total number of students. Perform a z-test for the user input expected proportion. Determine if the hypothesis that the actual proportion is different from the expected proportion should be rejected at the alpha = 0.01 significance level. Ex: When the input is: . 0.5 2.0 the ouput is (4.902, 0.000) The two-tailed p-value, 0.000, is less than a. Thus, sufficient evidence exists to support the hypothesis that the proportion is different from 0.5 4360102236122qmay LAB ACTIVITY 3.10.1: One-sample hypothesis test for population proportion 1 import statsmodels.stats as st 2 from statsmodels.stats.proportion import proportions_ztest 3 import pandas as pd 4 5 # Read in gpa.csv 6 gpa = # Your code here 7 3 # Get the value of the proportion for the null hypothesis 9 value float(input()) 10 # Get the gpa cutoff 11 cutoff- float(input ()) 12 13 # Determine the number of students with a gpa higher than cutoff 14 counts Your code here 15 16 # Determine the total number of students 17 nobs # Your code here 18 19 # Perform z-test for counts, nobs, and value 20 ztest = # Your code here 21 print("(", end-"") 22 print("%.3f % ztest[0] +", ", end="") 23 print('%.3f % ztest[1] + ")") 24 25 26 if ztest[1] < 0.01: 27 28 main.py 29 else: 30 peint("The two-tolled c-uslus print("The two-tailed p-value, ", end-"") print('%.3f % ztest[1] +", is less than \u0381. Thus, sufficient evidence exists to support the hypothesis that W and-"") 1/3 Load default template.. 1 import statsmodels.stats as st 2 from statsmodels.stats.proportion import proportions_ztest 3 import pandas as pd 4 5 # Read in gpa.csv 6 gpa = # Your code here 7 8 # Get the value of the proportion for the null hypothesis 9 value = float(input()) 10 # Get the gpa cutoff 11 cutoff = float(input()) main.py 12 13 # Determine the number of students with a gpa higher than cutoff 14 counts = # Your code here 15 16 Determine the total number of students 17 nobs = # Your code here 18 19 # Perform z-test for counts, nobs, and value 20 ztest = # Your code here 21 print("(", end="") 22 print('%.3f' % ztest [0] + ",", end="") 23 print("%.3f % ztest[1] + ")") 24 25 26 if ztest[1] < 0.01: 27 28 29 else: 30 31 Load default template... print("The two-tailed p-value, ", end="") print("%.3f' % ztest[1] + ", is less than \u03B1. Thus, sufficient evidence exists to support the hypothesis that Whon donn print("The two-tailed p-value, ", end="") print('%.3f % ztest [1] + ", is greater than u03B1. Thus, insufficient evidence exists to support the hypothesis the ouput is. (4.902, 0.000) The two-tailed p-value, 0.000, is less than a. Thus, sufficient evidence exists to support the hypothesis that the proportion is different from 0.5 LAB ACTIVITY 1 2 tions_ztest 3 4 S 6 7 8 hypothesis 10 11 12 13 igher than cutoff 14 15 16 17 18 19 20 21 3.10.1 One-sample hypothesis test for population proportion 22 23 24 25 26 main.py Load default template... 27 28 u03B1. Thus, sufficient evidence exists to support the hypothesis that the proportion is different from", value) 2.9 1/3 30 31 n \u93B1. Thus, insufficient evidence exists to support the hypothesis that the proportion is different from", value) I
Step by Step Solution
3.48 Rating (148 Votes )
There are 3 Steps involved in it
import statsmodelsstats as st from statsmodelsstatsproportion import proportionsztest import p... View full answer

Get step-by-step solutions from verified subject matter experts


