

Answered step by step
Verified Expert Solution
Question
1 Approved Answer
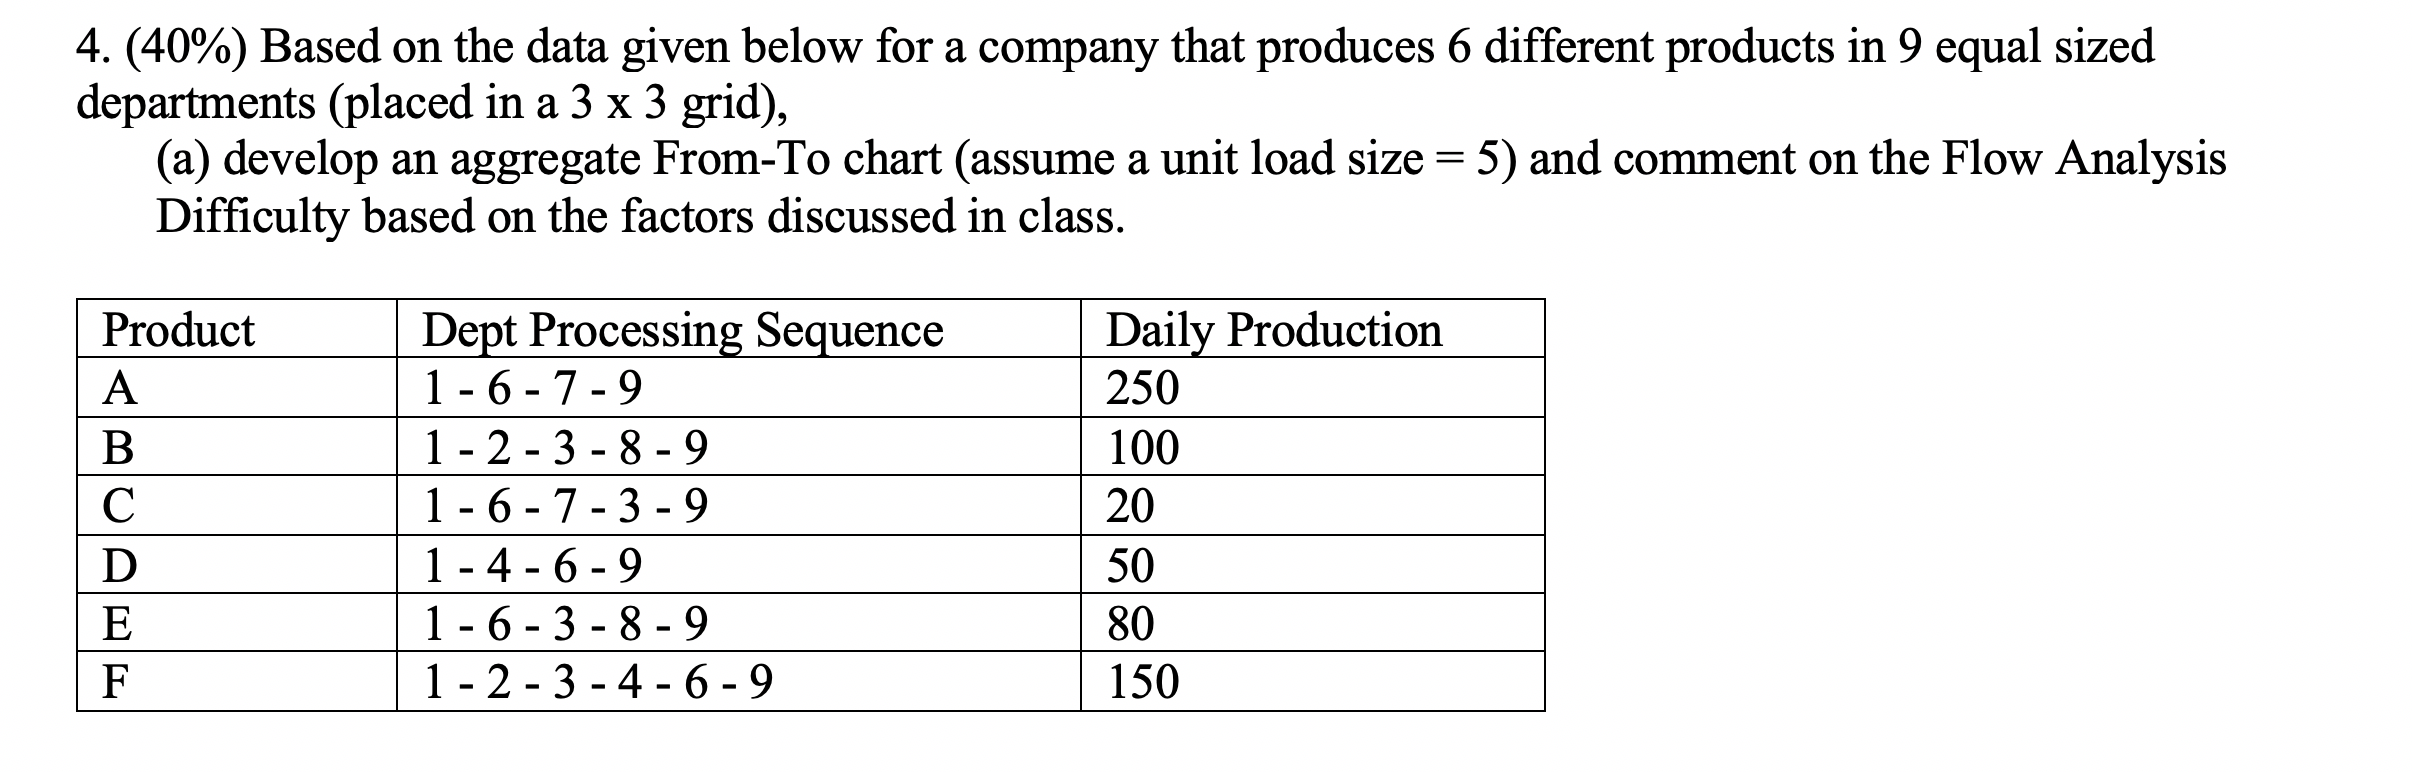
4. (40%) Based on the data given below for a company that produces 6 different products in 9 equal sized departments (placed in a 3
Step by Step Solution
There are 3 Steps involved in it
Step: 1

Get Instant Access to Expert-Tailored Solutions
See step-by-step solutions with expert insights and AI powered tools for academic success
Step: 2

Step: 3
Ace Your Homework with AI
Get the answers you need in no time with our AI-driven, step-by-step assistance
Get Started
Financial Accounting Self Study Problems/Solutions Book
Authors: Jerry J. Weygandt, Donald E. Kieso, Paul D. Kimmel
4th Edition
0471205133, 978-0471205135