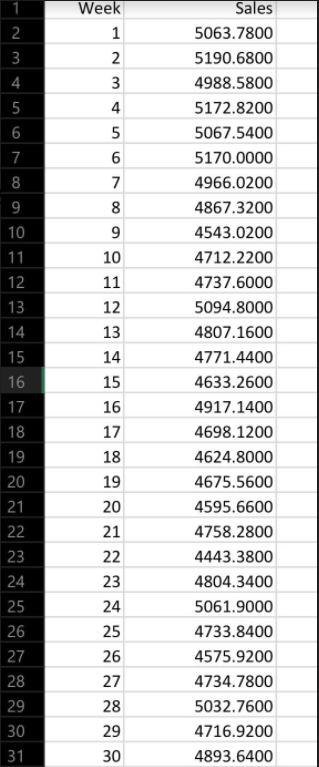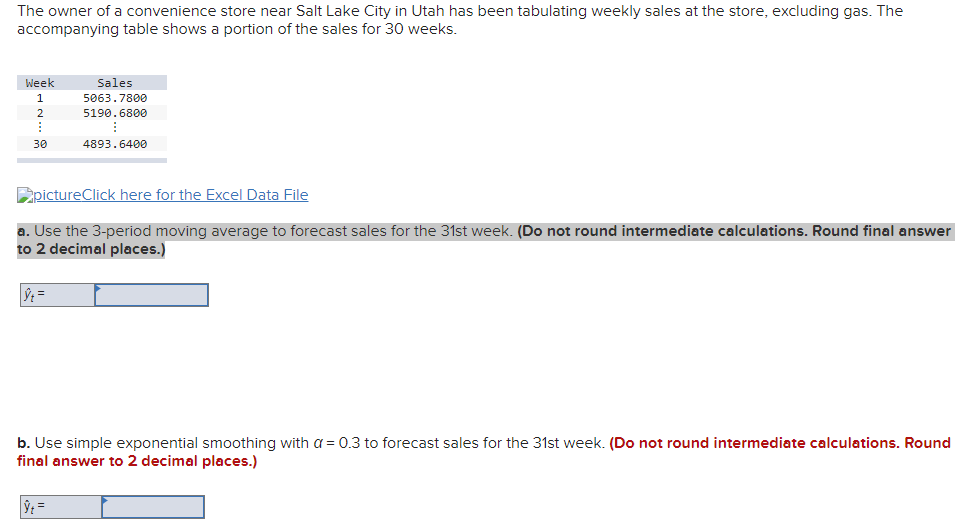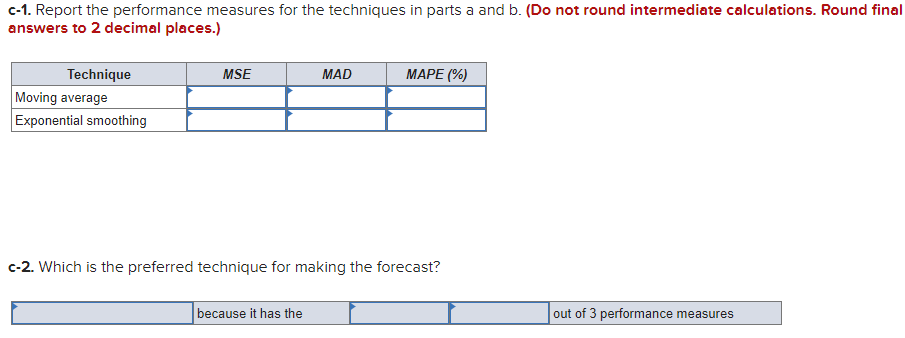


4 5 6 3 4 1 2 3 4 5 6 7 8 9 10 11. Week 1 2. 3 4 5 6 7 8 9 10 11 12 13 14 15 16 17 12 13 14 15 16 17 18 Sales 5063.7800 5190.6800 4988.5800 5172.8200 5067.5400 5170.0000 4966.0200 4867.3200 4543.0200 4712.2200 4737.6000 5094.8000 4807.1600 4771.4400 4633.2600 4917.1400 4698.1200 4624.8000 4675.5600 4595.6600 4758.2800 4443.3800 4804.3400 5061.9000 4733.8400 4575.9200 4734.7800 5032.7600 4716.9200 4893.6400 19 18 20 21 22 19 20 21 23 24 25 26 27 28 29 30 31 22 23 24 25 26 27 28 29 30 The owner of a convenience store near Salt Lake City in Utah has been tabulating weekly sales at the store, excluding gas. The accompanying table shows a portion of the sales for 30 weeks. Week 1 2 Sales 5063.7800 5190.6800 : 4893.6400 30 picture Click here for the Excel Data File a. Use the 3-period moving average to forecast sales for the 31st week. (Do not round intermediate calculations. Round final answer to 2 decimal places.) r = b. Use simple exponential smoothing with a = 0.3 to forecast sales for the 31st week. (Do not round intermediate calculations. Round final answer to 2 decimal places.) : = C-1. Report the performance measures for the techniques in parts a and b. (Do not round intermediate calculations. Round final answers to 2 decimal places.) MSE MAD MAPE (%) Technique Moving average Exponential smoothing c-2. Which is the preferred technique for making the forecast? because it has the out of 3 performance measures 4 5 6 3 4 1 2 3 4 5 6 7 8 9 10 11. Week 1 2. 3 4 5 6 7 8 9 10 11 12 13 14 15 16 17 12 13 14 15 16 17 18 Sales 5063.7800 5190.6800 4988.5800 5172.8200 5067.5400 5170.0000 4966.0200 4867.3200 4543.0200 4712.2200 4737.6000 5094.8000 4807.1600 4771.4400 4633.2600 4917.1400 4698.1200 4624.8000 4675.5600 4595.6600 4758.2800 4443.3800 4804.3400 5061.9000 4733.8400 4575.9200 4734.7800 5032.7600 4716.9200 4893.6400 19 18 20 21 22 19 20 21 23 24 25 26 27 28 29 30 31 22 23 24 25 26 27 28 29 30 The owner of a convenience store near Salt Lake City in Utah has been tabulating weekly sales at the store, excluding gas. The accompanying table shows a portion of the sales for 30 weeks. Week 1 2 Sales 5063.7800 5190.6800 : 4893.6400 30 picture Click here for the Excel Data File a. Use the 3-period moving average to forecast sales for the 31st week. (Do not round intermediate calculations. Round final answer to 2 decimal places.) r = b. Use simple exponential smoothing with a = 0.3 to forecast sales for the 31st week. (Do not round intermediate calculations. Round final answer to 2 decimal places.) : = C-1. Report the performance measures for the techniques in parts a and b. (Do not round intermediate calculations. Round final answers to 2 decimal places.) MSE MAD MAPE (%) Technique Moving average Exponential smoothing c-2. Which is the preferred technique for making the forecast? because it has the out of 3 performance measures


