

Answered step by step
Verified Expert Solution
Question
1 Approved Answer
4 60 70 81 90 101 110 120 For QDM Inc. calculate the cash build for 2010? The financial statements for QDM Inc. are given
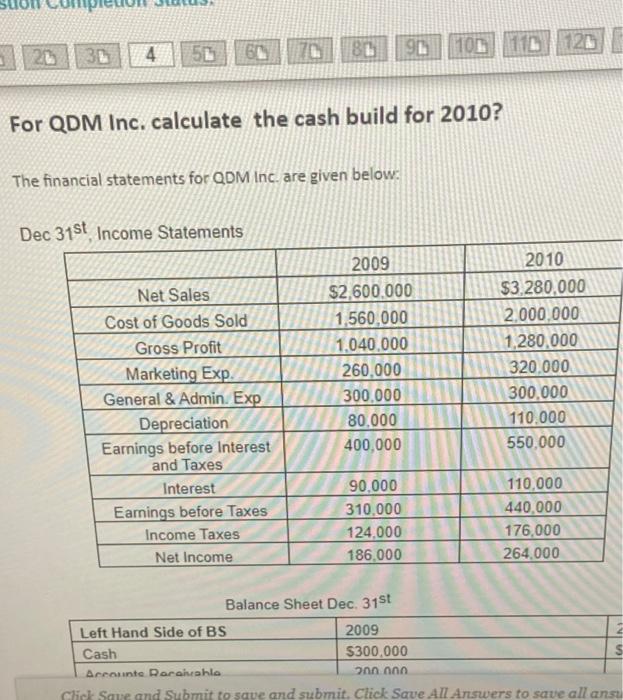
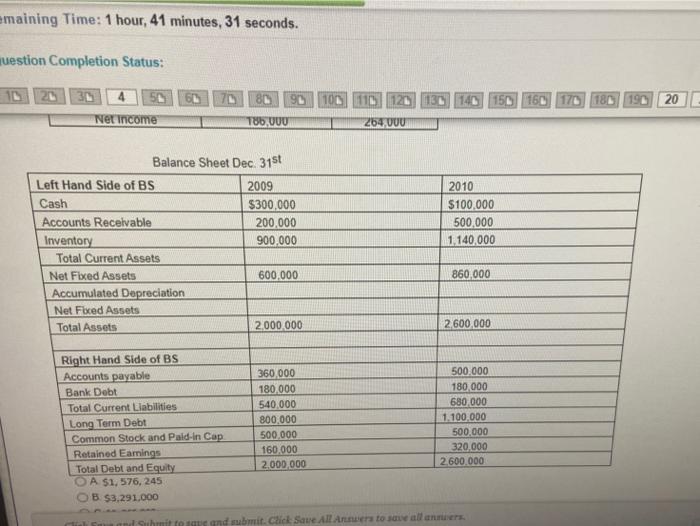
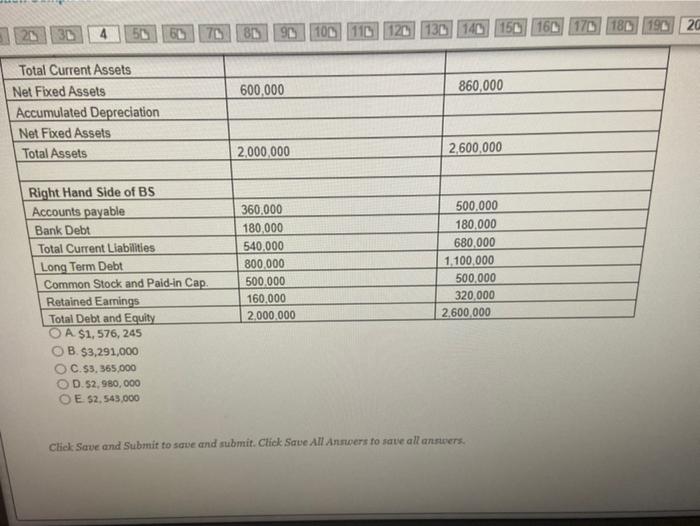 4 60 70 81 90 101 110 120 For QDM Inc. calculate the cash build for 2010? The financial statements for QDM Inc. are given below. Dec 31st Income Statements Net Sales Cost of Goods Sold Gross Profit Marketing Exp General & Admin. Exp Depreciation Earnings before Interest and Taxes Interest Earings before Taxes Income Taxes Net Income 2009 $2,600.000 1,560,000 1.040.000 260,000 300.000 80.000 400,000 2010 $3,280,000 2.000.000 1,280,000 320.000 300,000 110.000 550,000 90.000 310.000 124.000 186.000 110,000 440,000 176,000 264.000 Balance Sheet Dec. 31st Left Hand Side of BS 2009 Cash $300,000 s Account Barakahla 2nnnnn chist Saue and Submit to save and submit. Click Save All Answers to save all ansu emaining Time: 1 hour, 41 minutes, 31 seconds. question Completion Status: 90 100 130 140 150 160 170 181 197 20 16 120 264,00U Ner income T86 UUU Balance Sheet Dec 31st Left Hand Side of BS 2009 Cash $300.000 Accounts Receivable 200,000 Inventory 900.000 Total Current Assets Net Fixed Assets 600,000 Accumulated Depreciation Net Fuced Assets Total Assets 2.000.000 2010 $100,000 500,000 1.140,000 860,000 2,600,000 Right Hand Side of BS Accounts payable Bank Debt Total Current Liabilities Long Term Debt Common Stock and Pald-in Cap Retained Earnings Total Debt and Equity OA $1,576, 245 OB $3,291,000 360 000 180,000 540,000 800,000 500.000 160.000 2.000.000 500.000 180 000 680,000 1.100.000 500.000 320,000 2 600 000 Submit to us and submit. Click Save All Are to sell aner 100 110 120 130 140 150 160 170 180 190 20 600,000 860,000 Total Current Assets Net Fixed Assets Accumulated Depreciation Net Foxed Assets Total Assets 2,000,000 2,600,000 Right Hand Side of BS Accounts payable Bank Debt Total Current Liabilities Long Term Debt Common Stock and Paid-in Cap. Retained Earings Total Debt and Equity O A $1,576, 245 OB. $3,291,000 OC.53,365,000 O D.52,980,000 O E $2.543,000 360.000 180,000 540.000 800.000 500.000 160,000 2,000,000 500.000 180.000 680,000 1.100.000 500,000 320,000 2.600,000 Click Save and Submit to save and submit. Click Save All Answers to sate all answers. 4 60 70 81 90 101 110 120 For QDM Inc. calculate the cash build for 2010? The financial statements for QDM Inc. are given below. Dec 31st Income Statements Net Sales Cost of Goods Sold Gross Profit Marketing Exp General & Admin. Exp Depreciation Earnings before Interest and Taxes Interest Earings before Taxes Income Taxes Net Income 2009 $2,600.000 1,560,000 1.040.000 260,000 300.000 80.000 400,000 2010 $3,280,000 2.000.000 1,280,000 320.000 300,000 110.000 550,000 90.000 310.000 124.000 186.000 110,000 440,000 176,000 264.000 Balance Sheet Dec. 31st Left Hand Side of BS 2009 Cash $300,000 s Account Barakahla 2nnnnn chist Saue and Submit to save and submit. Click Save All Answers to save all ansu emaining Time: 1 hour, 41 minutes, 31 seconds. question Completion Status: 90 100 130 140 150 160 170 181 197 20 16 120 264,00U Ner income T86 UUU Balance Sheet Dec 31st Left Hand Side of BS 2009 Cash $300.000 Accounts Receivable 200,000 Inventory 900.000 Total Current Assets Net Fixed Assets 600,000 Accumulated Depreciation Net Fuced Assets Total Assets 2.000.000 2010 $100,000 500,000 1.140,000 860,000 2,600,000 Right Hand Side of BS Accounts payable Bank Debt Total Current Liabilities Long Term Debt Common Stock and Pald-in Cap Retained Earnings Total Debt and Equity OA $1,576, 245 OB $3,291,000 360 000 180,000 540,000 800,000 500.000 160.000 2.000.000 500.000 180 000 680,000 1.100.000 500.000 320,000 2 600 000 Submit to us and submit. Click Save All Are to sell aner 100 110 120 130 140 150 160 170 180 190 20 600,000 860,000 Total Current Assets Net Fixed Assets Accumulated Depreciation Net Foxed Assets Total Assets 2,000,000 2,600,000 Right Hand Side of BS Accounts payable Bank Debt Total Current Liabilities Long Term Debt Common Stock and Paid-in Cap. Retained Earings Total Debt and Equity O A $1,576, 245 OB. $3,291,000 OC.53,365,000 O D.52,980,000 O E $2.543,000 360.000 180,000 540.000 800.000 500.000 160,000 2,000,000 500.000 180.000 680,000 1.100.000 500,000 320,000 2.600,000 Click Save and Submit to save and submit. Click Save All Answers to sate all answers
Step by Step Solution
There are 3 Steps involved in it
Step: 1

Get Instant Access to Expert-Tailored Solutions
See step-by-step solutions with expert insights and AI powered tools for academic success
Step: 2

Step: 3
Ace Your Homework with AI
Get the answers you need in no time with our AI-driven, step-by-step assistance
Get Started
Cost Accounting A Managerial Emphasis
Authors: Charles T. Horngren, Srikant M.Dater, George Foster, Madhav
14th Edition
978-0132960649, 132960648, 132109174, 978-0132109178