Answered step by step
Verified Expert Solution
Link Copied!

Question

1 Approved Answer

4. 8 points On the graph below, use demand, marginal revenue, marginal cost, and average total cost curves to illustrate a perfectly competitive firm earning
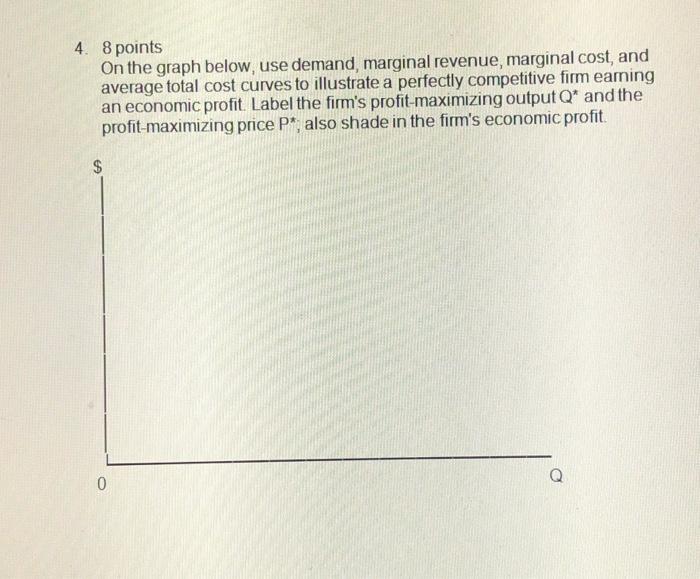
image text in transcribed
4. 8 points On the graph below, use demand, marginal revenue, marginal cost, and average total cost curves to illustrate a perfectly competitive firm earning an economic profit. Label the firm's profit-maximizing output Q* and the profit-maximizing price P*; also shade in the firm's economic profit. $ Q 0

Step by Step Solution

There are 3 Steps involved in it

Step: 1

blur-text-image

Get Instant Access to Expert-Tailored Solutions

See step-by-step solutions with expert insights and AI powered tools for academic success

Step: 2

blur-text-image_2

Step: 3

blur-text-image_3

Ace Your Homework with AI

Get the answers you need in no time with our AI-driven, step-by-step assistance

Get Started

Recommended Textbook for

Security Audit And Control Features Oracle E Business Suite

Authors: Deloitte Touche Tohmatsu Research Team And Isaca

3rd Edition

1604201061, 978-1604201062

More Books

Students also viewed these Accounting questions

Question

Draw up an organization chart for your college or university.

Answered: 1 week ago

Question

What are the stages of project management? Write it in items.

Answered: 1 week ago

Question

why do consumers often fail to seek out higher yields on deposits ?

Answered: 1 week ago

Question

1-4 How will MIS help my career?

Answered: 1 week ago