

Answered step by step
Verified Expert Solution
Question
1 Approved Answer
4. [8 points) The figures below show plots of monthly excess returns for two stocks plotted against excess returns for a market index. Excess Returns
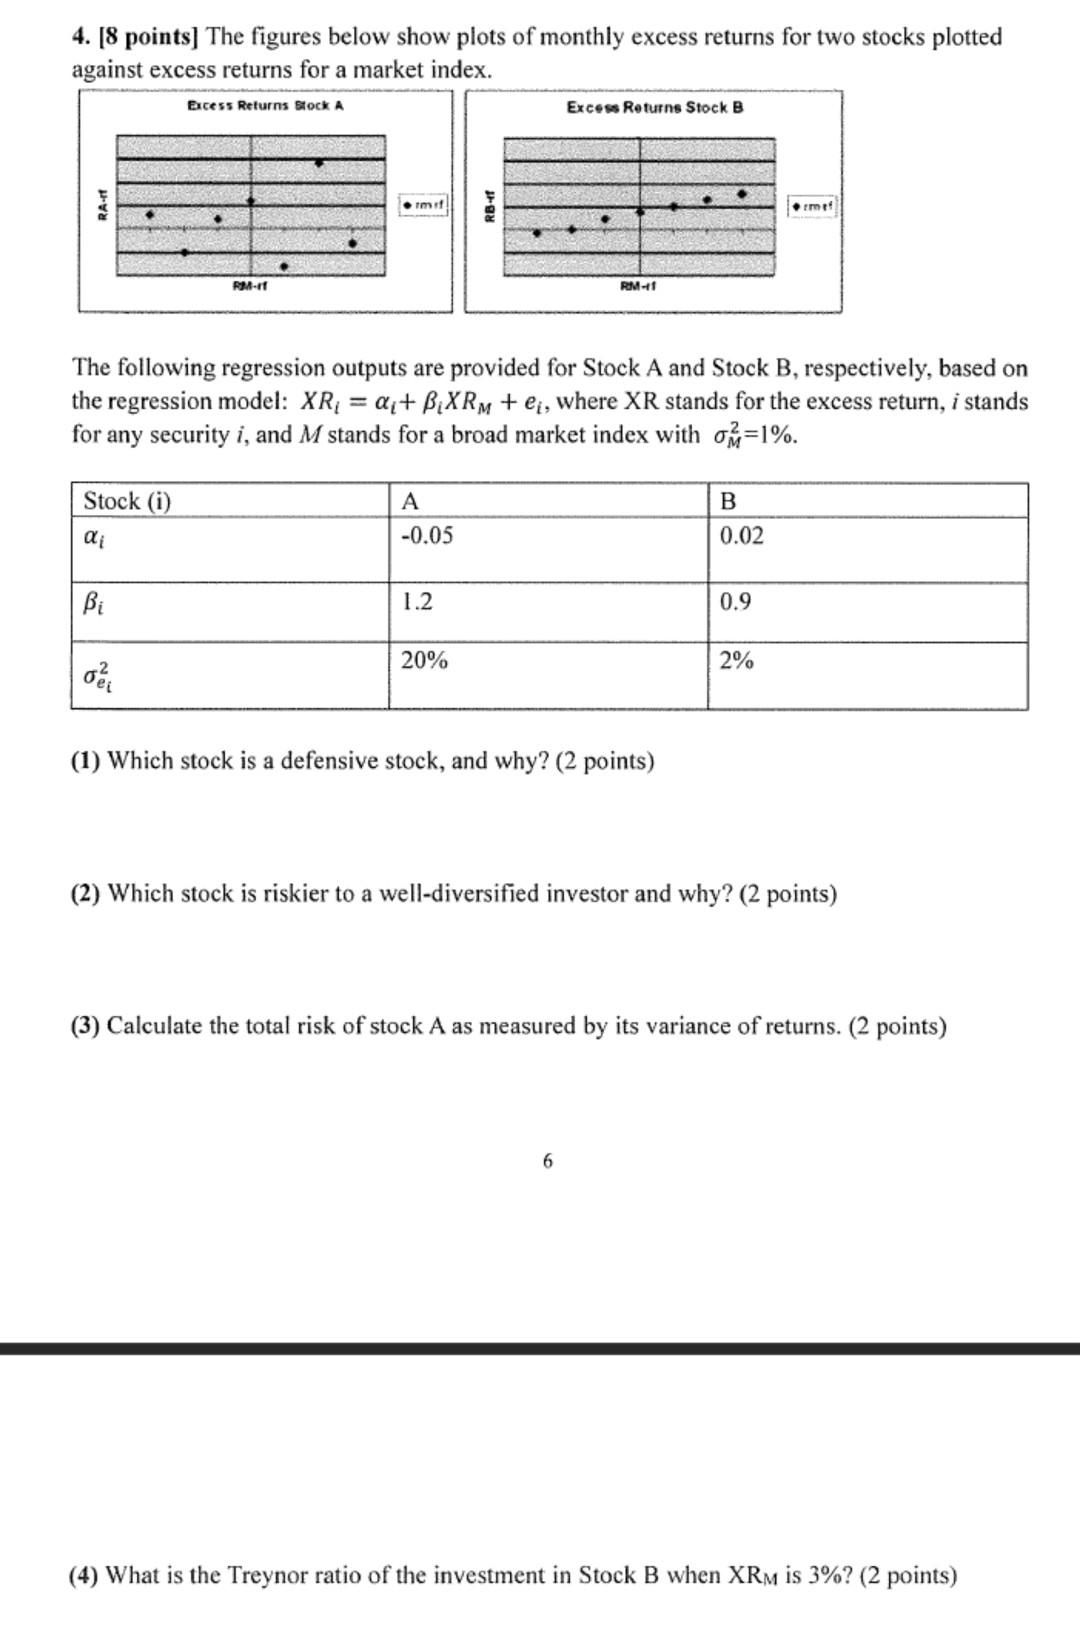
4. [8 points) The figures below show plots of monthly excess returns for two stocks plotted against excess returns for a market index. Excess Returns Stock A Excess Returns Stock B RA- mit 21.11 ROM-1 The following regression outputs are provided for Stock A and Stock B, respectively, based on the regression model: XR1 = Qi + BAXRM + e, where XR stands for the excess return, i stands for any security i, and M stands for a broad market index with o=1%. Stock (i) A -0.05 B 0.02 Bi 1.2 0.9 20% 2% of (1) Which stock is a defensive stock, and why? (2 points) (2) Which stock is riskier to a well-diversified investor and why? (2 points) (3) Calculate the total risk of stock A as measured by its variance of returns. (2 points) 6 (4) What is the Treynor ratio of the investment in Stock B when XRM is 3%? (2 points)
Step by Step Solution
There are 3 Steps involved in it
Step: 1

Get Instant Access to Expert-Tailored Solutions
See step-by-step solutions with expert insights and AI powered tools for academic success
Step: 2

Step: 3
Ace Your Homework with AI
Get the answers you need in no time with our AI-driven, step-by-step assistance
Get Started
Modern Portfolio Theory and Investment Analysis
Authors: Edwin Elton, Martin Gruber, Stephen Brown, William Goetzmann
9th edition
9781118805800, 1118469941, 1118805801, 978-1118469941