

Question
4. A Matlab program has been written up for you to calculate daily mean solar insolation and its saved in the file solar_insolation.m. Run it
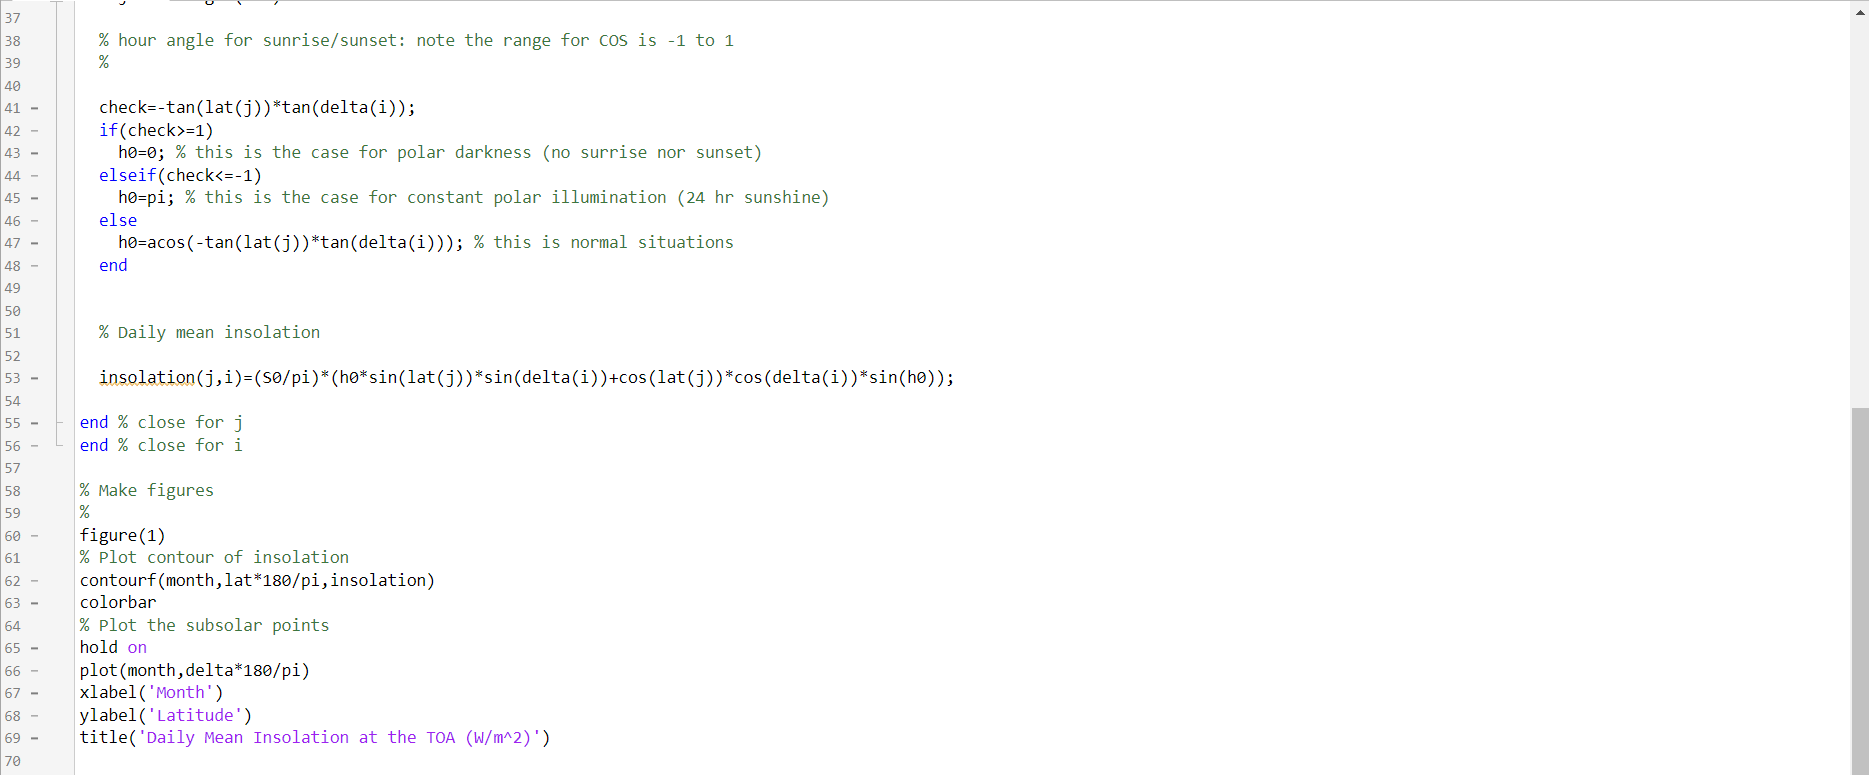
4. A Matlab program has been written up for you to calculate daily mean solar insolation and its saved in the file solar_insolation.m. Run it on your computer. (You may simply save the file to your working directory and type solar_insolation at the command prompt of Matlab, or alternatively, you can copy and paste the code piece by piece onto the Matlab Command Window to run it). After running the program, you should see a figure of solar insolation as a function of latitude and month that is the same as I show in class. Study solar_insolation.m carefully. Try to understand how it does the calculation, especially how it constructs the two-dimensional array insolation (i.e., solar insolation as a function of latitude and season). Build upon the code and do the following:
4.1 (10 points) Plot solar insolation as a function of time (i.e., 12 months) for latitude 40N, i.e., latitude of NYC. Include both your code and figure in your report. Hint: Insolation is a 2D array, one dimension is latitude and the other is time. A 2D array is like an Excel table. When latitude is fixed (40N), the only dimension that varies is the time dimension. This is like checking a specific column (or row) of a 2D table. All you need to do is to find out which column (or row) you should select. Note that in the code, latitude increases by 5 degree from -90 (South Pole) to 90 (North Pole). You need to figure out the index for latitude 400N
4.2 (10 points) Do the same as 1.1 for latitude zero, i.e., the Equator. Include both your code and figure.
4.3 (10 points) Which month shows the maximum solar insolation for 400N? What about the Equator: which months show the maximum? Why does the equator have multiple peaks in solar radiation, whereas 400N only has one peak?
4.4 (10 points) Plot solar insolation as a function of latitude for 1) January and 2) July. Hint: now fix the time dimension and let the latitude dimension vary. Include your code and figure.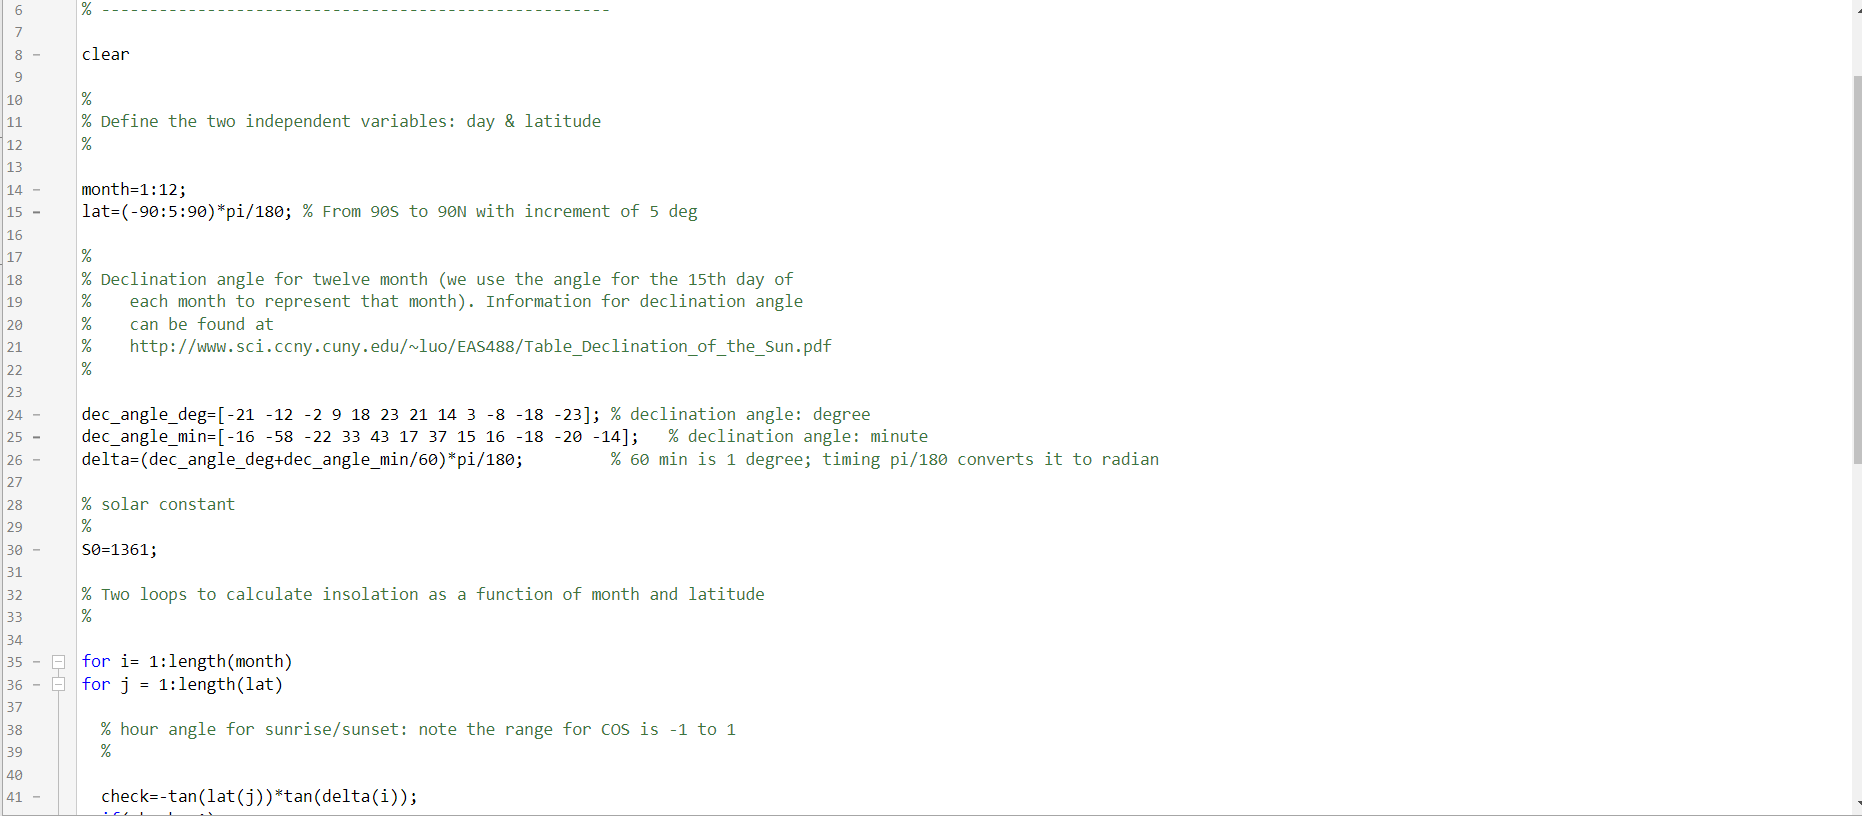
Step by Step Solution
There are 3 Steps involved in it
Step: 1

Get Instant Access to Expert-Tailored Solutions
See step-by-step solutions with expert insights and AI powered tools for academic success
Step: 2

Step: 3
Ace Your Homework with AI
Get the answers you need in no time with our AI-driven, step-by-step assistance
Get Started
Practical Neo4j
Authors: Gregory Jordan
1st Edition
1484200225, 9781484200223