Answered step by step
Verified Expert Solution
Question
1 Approved Answer
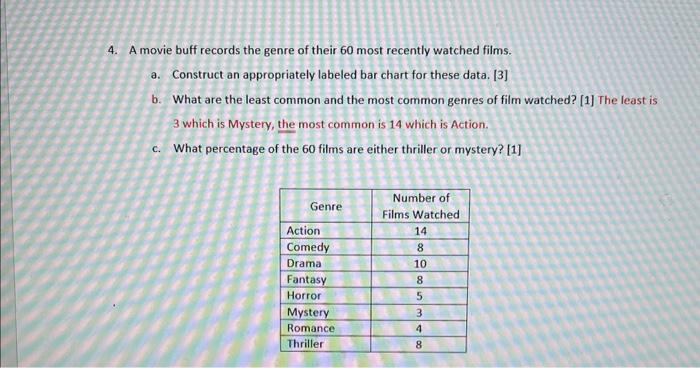
4. A movie buff records the genre of their 60 most recently watched films. a. Construct an appropriately labeled bar chart for these data.


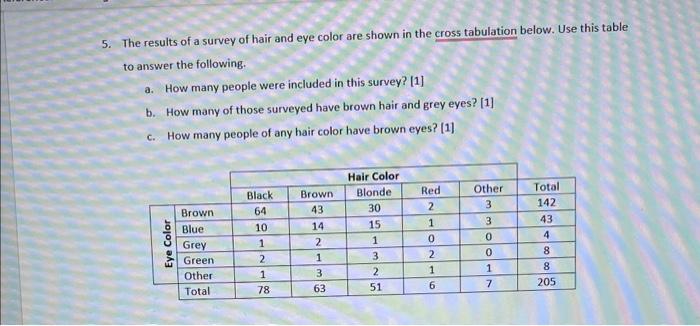
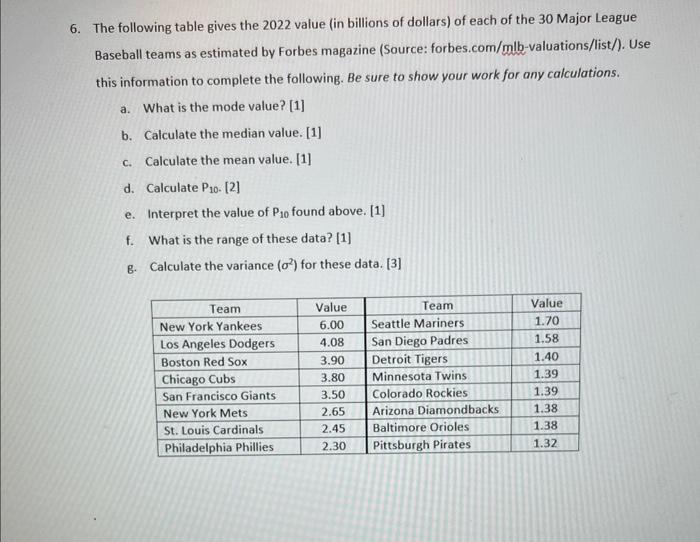
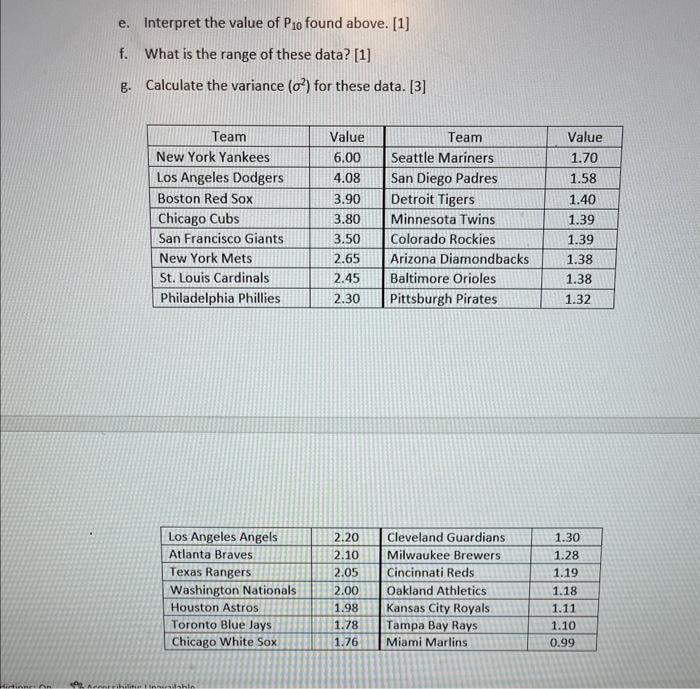
4. A movie buff records the genre of their 60 most recently watched films. a. Construct an appropriately labeled bar chart for these data. [3] b. What are the least common and the most common genres of film watched? [1] The least is 3 which is Mystery, the most common is 14 which is Action. c. What percentage of the 60 films are either thriller or mystery? [1] Genre Action Comedy Drama Fantasy Horror Mystery Romance Thriller Number of Films Watched 14 8 10 8 53400 8 5. The results of a survey of hair and eye color are shown in the cross tabulation below. Use this table to answer the following. a. How many people were included in this survey? [1] b. How many of those surveyed have brown hair and grey eyes? [1] c. How many people of any hair color have brown eyes? [1] Eye Color Brown Blue Grey Green: Other Total Black 64 10 1 2 1 78 Brown. 43 14 2 1 3 63 Hair Color Blonde 30 15 1 3 2 51 Red 2 1 0 2 1 6 Other 3 3 0 0 1 7 Total 142 43 4 8 8 205 6. The following table gives the 2022 value (in billions of dollars) of each of the 30 Major League. Baseball teams as estimated by Forbes magazine (Source: forbes.com/mlb-valuations/list/). Use this information to complete the following. Be sure to show your work for any calculations. a. What is the mode value? [1] b. Calculate the median value. [1] c. Calculate the mean value. [1] d. Calculate P10- [2] e. Interpret the value of P10 found above. [1] f. What is the range of these data? [1] g. Calculate the variance (o) for these data. [3] Team New York Yankees Los Angeles Dodgers Boston Red Sox Chicago Cubs San Francisco Giants New York Mets St. Louis Cardinals Philadelphia Phillies Value 6.00 4.08 3.90 3.80 3.50 2.65 2.45 2.30 Team Seattle Mariners San Diego Padres Detroit Tigers Minnesota Twins. Colorado Rockies Arizona Diamondbacks Baltimore Orioles Pittsburgh Pirates Value 1.70 1.58 1.40 1.39 1.39 1.38 1.38 1.32 Hirtinnes An e. Interpret the value of P10 found above. [1] f. What is the range of these data? [1] g. Calculate the variance (o) for these data. [3] Team New York Yankees Los Angeles Dodgers Boston Red Sox. Chicago Cubs San Francisco Giants New York Mets St. Louis Cardinals Philadelphia Phillies Los Angeles Angels Atlanta Braves Texas Rangers Washington Nationals. Houston Astros Toronto Blue Jays Chicago White Sox ieeneribility insusidshin Value 6.00 4.08 3.90 3.80 3.50 2.65 2.45 2.30 Team Seattle Mariners San Diego Padres Detroit Tigers Minnesota Twins Colorado Rockies Arizona Diamondbacks Baltimore Orioles Pittsburgh Pirates 2.20 Cleveland Guardians Milwaukee Brewers Cincinnati Reds 2.10 2.05 2.00 1.98 1.78. 1.76 Oakland Athletics Kansas City Royals Tampa Bay Rays Miami Marlins Value 1.70 1.58 1.40 1.39 1.39 1.38 1.38 1.32 1.30 1.28 1.19 1.18 1.11 1.10 0.99
Step by Step Solution
★★★★★
3.38 Rating (154 Votes )
There are 3 Steps involved in it
Step: 1
a To construct an appropriately labeled bar chart for the given data you can follow these steps 1 Cr...
Get Instant Access to Expert-Tailored Solutions
See step-by-step solutions with expert insights and AI powered tools for academic success
Step: 2

Step: 3

Ace Your Homework with AI
Get the answers you need in no time with our AI-driven, step-by-step assistance
Get Started


