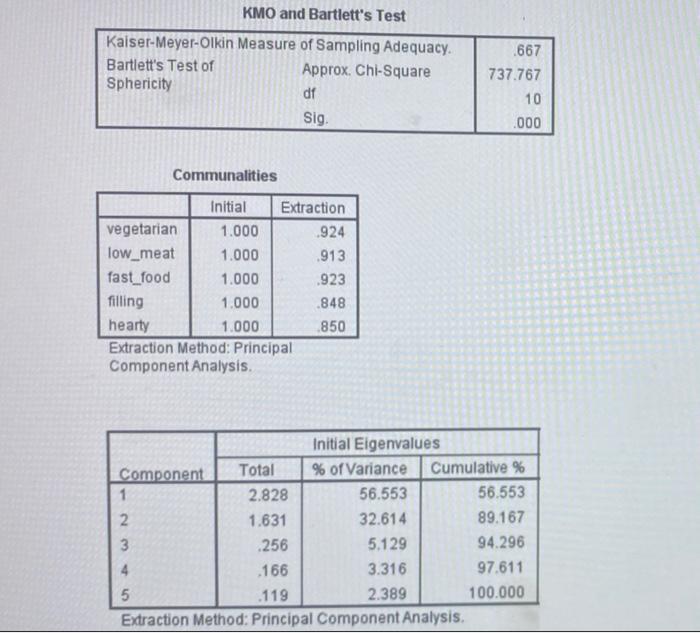
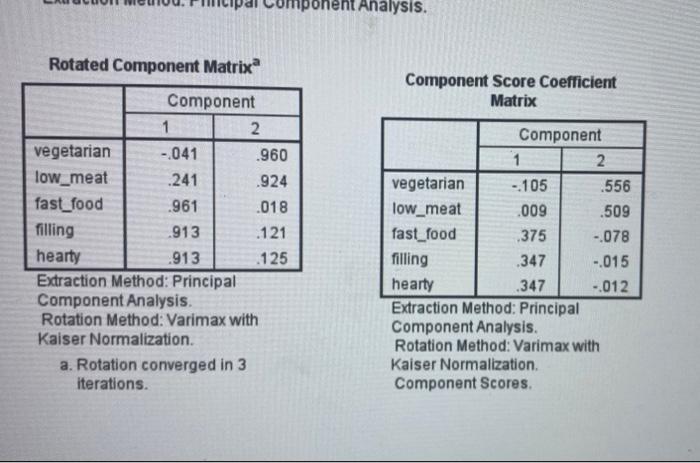
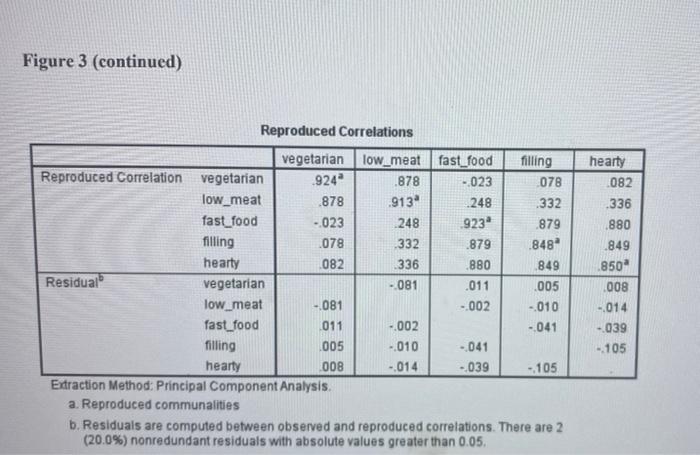
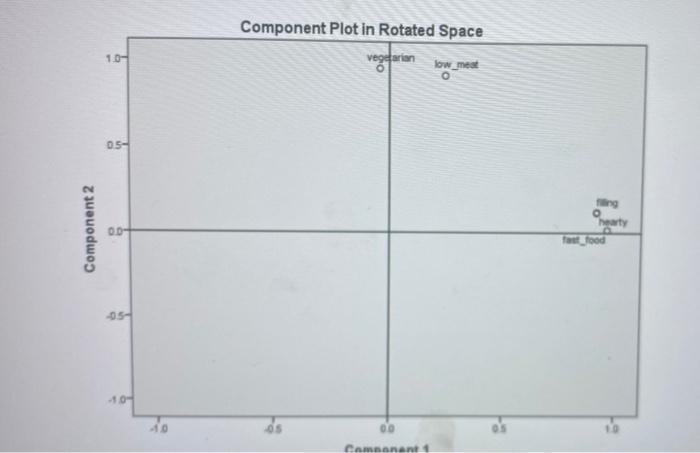
4. (a) The dietary characteristics of 200 respondents were recorded in a survey. Respondents were asked to rate the extent to which their diet agreed with the following descriptors: fast food filling hearty low meat vegetarian Figure 3 (spread over the next two pages) presents selected SPSS output from a factor analysis with principal components extraction, using the varimax rotation procedure. Interpret the output. In your analysis, be sure to address at least the following: Explain how you determine the number of factors and interpret the extracted factors. Explain qualitatively and quantitatively how the fit of the factor analysis model should be examined. . Briefly discuss for what modelling purpose(s) extracted factors could be used. a KMO and Bartlett's Test Kaiser-Meyer-Olkin Measure of Sampling Adequacy. Bartlett's Test of Approx. Chi-Square Sphericity df Sig 667 737.767 10 .000 Communalities Initial Extraction vegetarian 1.000 924 low_meat 1.000 913 fast_food 1.000 .923 filling 1.000 .848 hearty 1.000 .850 Extraction Method: Principal Component Analysis Initial Eigenvalues Component Total % of Variance Cumulative % 1 2.828 56.553 56,553 2. 1.631 32.614 89.167 3 .256 5.129 94.296 4 .166 3.316 97.611 5 .119 2.389 100.000 Extraction Method: Principal Component Analysis nponent Analysis Rotated Component Matrix Component Score Coefficient Matrix Component 1 2 vegetarian - 041 .960 low_meat .241 .924 fast_food .961 .018 filling .913 .121 hearty .913 .125 Extraction Method: Principal Component Analysis. Rotation Method: Varimax with Kaiser Normalization. a. Rotation converged in 3 iterations Component 1 2. vegetarian - 105 .556 low_meat .009 .509 fast_food .375 -.078 filling .347 -.015 hearty .347 -.012 Extraction Method: Principal Component Analysis. Rotation Method: Varimax with Kaiser Normalization. Component Scores. Figure 3 (continued) hearty 082 .336 880 .849 .850" Reproduced Correlations vegetarian low_meat fast_food filling Reproduced Correlation vegetarian 924 .878 -.023 078 low_meat .878 .913 .248 332 fast_food -023 .248 923 .879 filling .078 332 1879 .848 hearty 082 336 880 .849 Residual vegetarian - 081 .011 .005 low_meat - 081 -002 - 010 fast_food 011 -002 -041 filling 005 -010 -041 hearty 008 -014 - 039 - 105 Extraction Method: Principal Component Analysis. a. Reproduced communalities b. Residuals are computed between observed and reproduced correlations. There are 2 (20.0%) nonredundant residuals with absolute values greater than 0.05. 008 -.014 -039 -105 Component Plot in Rotated Space 10- vegetarian o low_med O 05- Component 2 ng hearty OD feet food 05- -10- -10 00 Camanent 4. (a) The dietary characteristics of 200 respondents were recorded in a survey. Respondents were asked to rate the extent to which their diet agreed with the following descriptors: fast food filling hearty low meat vegetarian Figure 3 (spread over the next two pages) presents selected SPSS output from a factor analysis with principal components extraction, using the varimax rotation procedure. Interpret the output. In your analysis, be sure to address at least the following: Explain how you determine the number of factors and interpret the extracted factors. Explain qualitatively and quantitatively how the fit of the factor analysis model should be examined. . Briefly discuss for what modelling purpose(s) extracted factors could be used. a KMO and Bartlett's Test Kaiser-Meyer-Olkin Measure of Sampling Adequacy. Bartlett's Test of Approx. Chi-Square Sphericity df Sig 667 737.767 10 .000 Communalities Initial Extraction vegetarian 1.000 924 low_meat 1.000 913 fast_food 1.000 .923 filling 1.000 .848 hearty 1.000 .850 Extraction Method: Principal Component Analysis Initial Eigenvalues Component Total % of Variance Cumulative % 1 2.828 56.553 56,553 2. 1.631 32.614 89.167 3 .256 5.129 94.296 4 .166 3.316 97.611 5 .119 2.389 100.000 Extraction Method: Principal Component Analysis nponent Analysis Rotated Component Matrix Component Score Coefficient Matrix Component 1 2 vegetarian - 041 .960 low_meat .241 .924 fast_food .961 .018 filling .913 .121 hearty .913 .125 Extraction Method: Principal Component Analysis. Rotation Method: Varimax with Kaiser Normalization. a. Rotation converged in 3 iterations Component 1 2. vegetarian - 105 .556 low_meat .009 .509 fast_food .375 -.078 filling .347 -.015 hearty .347 -.012 Extraction Method: Principal Component Analysis. Rotation Method: Varimax with Kaiser Normalization. Component Scores. Figure 3 (continued) hearty 082 .336 880 .849 .850" Reproduced Correlations vegetarian low_meat fast_food filling Reproduced Correlation vegetarian 924 .878 -.023 078 low_meat .878 .913 .248 332 fast_food -023 .248 923 .879 filling .078 332 1879 .848 hearty 082 336 880 .849 Residual vegetarian - 081 .011 .005 low_meat - 081 -002 - 010 fast_food 011 -002 -041 filling 005 -010 -041 hearty 008 -014 - 039 - 105 Extraction Method: Principal Component Analysis. a. Reproduced communalities b. Residuals are computed between observed and reproduced correlations. There are 2 (20.0%) nonredundant residuals with absolute values greater than 0.05. 008 -.014 -039 -105 Component Plot in Rotated Space 10- vegetarian o low_med O 05- Component 2 ng hearty OD feet food 05- -10- -10 00 Camanent
