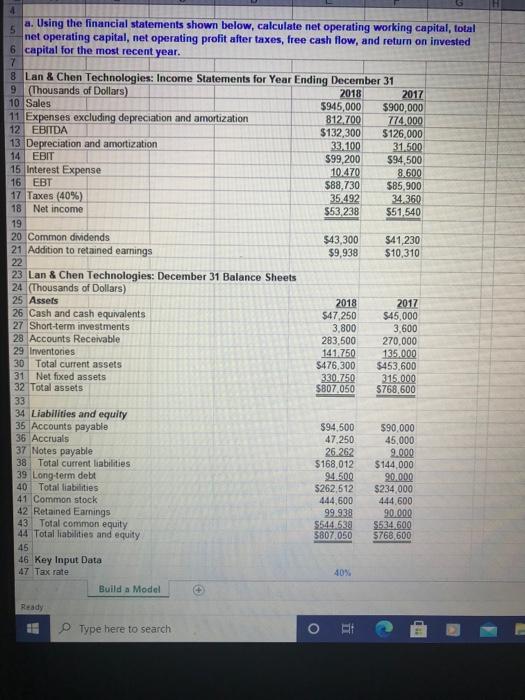
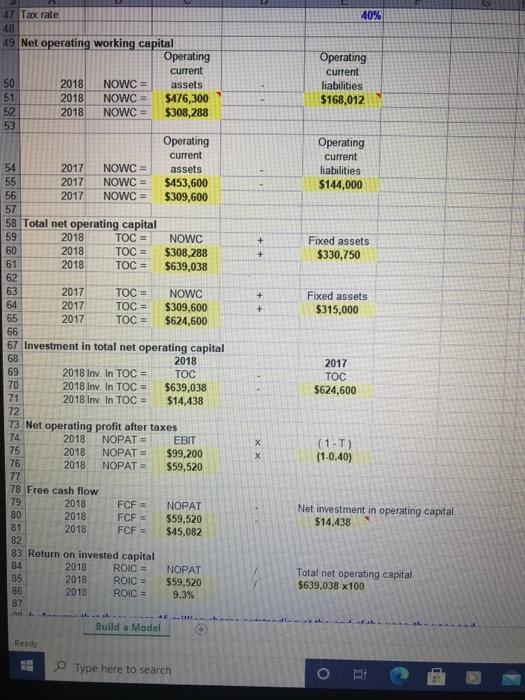
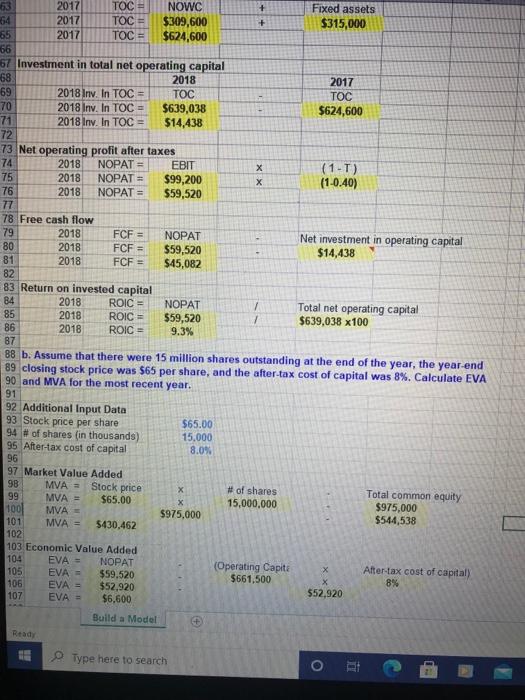
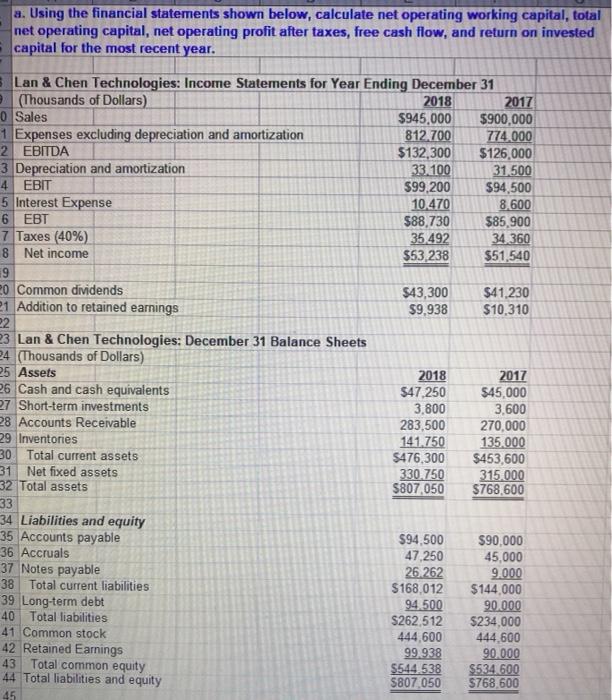
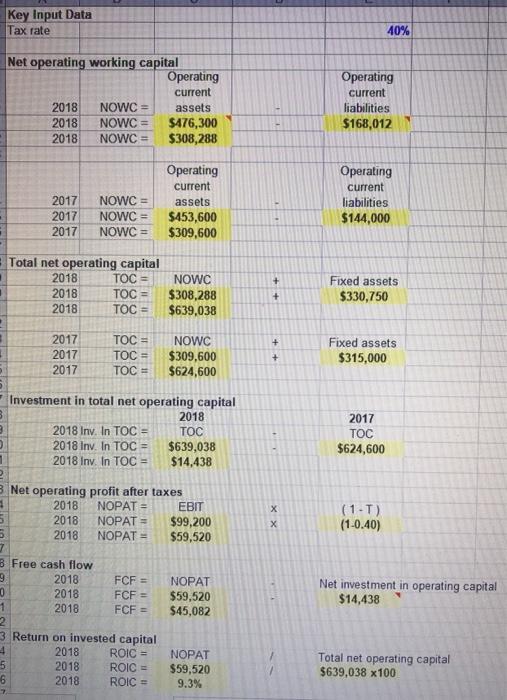
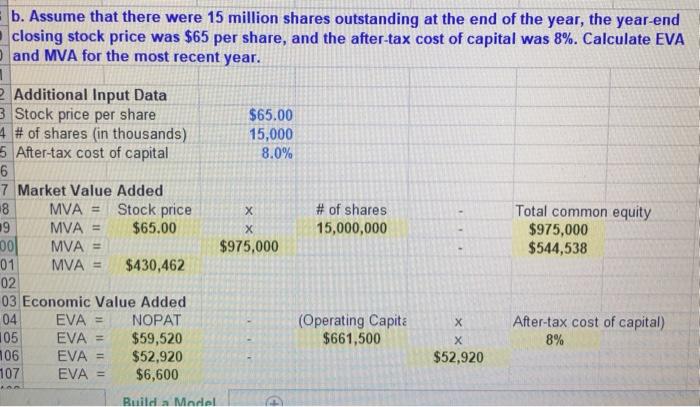
4 a. Using the financial statements shown below, calculate net operating working capital, total 5 net operating capital, net operating profit after taxes, free cash flow, and return on invested 6 capital for the most recent year. 7 8 Lan & Chen Technologies: Income Statements for Year Ending December 31 9 (Thousands of Dollars) 2018 2017 10 Sales 5945,000 $900,000 11 Expenses excluding depreciation and amortization 812 700 774.000 12 EBITDA $132,300 $126.000 13 Depreciation and amortization 33,100 31.500 14 EBIT $99,200 $94,500 15 Interest Expense 10.470 8.600 16 EBT $88,730 $85,900 17 Taxes (40%) 35.492 34 360 18 Net income $53.238 $51.540 19 20 Common dividends $43,300 $41,230 21 Addition to retained earnings $9,938 $10,310 22 23 Lan & Chen Technologies: December 31 Balance Sheets 24 (Thousands of Dollars) 25 Assets 2018 2017 26 Cash and cash equivalents $47,250 $45,000 27 Short-term investments 3,800 3,600 28 Accounts Receivable 283,500 270,000 29 Inventories 141.750 135.000 30 Total current assets $476,300 $453,600 31 Net fixed assets 330.750 315.000 32 Total assets $807050 $768,600 33 34 Liabilities and equity 35 Accounts payable $94,500 $90.000 36 Accruals 47.250 45,000 37 Notes payable 26.262 9.000 38 Total current liabilities $168,012 $144,000 39 Long-term debt 94.500 90.000 40 Total liabilities $262,512 $234 000 41 Common stock 444,600 444,600 42 Retained Earnings 99.938 90.000 43 Total common equity $544,529 S534 600 44 Total liabilities and equity 5807,050 $768,600 45 46 Key Input Data 47 Tax rate 40% Build a Model Ready Type here to search ma 40% Operating current liabilities $168,012 Operating current liabilities $144,000 + + Fixed assets $330,750 + 47 Tax rate 48 49 Net operating working capital Operating current 50 2018 NOWC = assets 51 2018 NOWC $476,300 52 2018 NOWC = $308,288 53 Operating current 54 2017 NOWC = assets 55 2017 NOWC = $453,600 56 2017 NOWC = $309,600 57 58 Total net operating capital 59 2018 TOC = NOWC 60 2018 TOC = $308,288 61 2018 TOC = $639,038 62 63 2017 TOC NOWC 64 2017 TOC = $309,600 65 2017 TOC $624,600 66 67 Investment in total net operating capital 68 2018 69 2018 Inv. In TOC = TOC 70 2018 Inv. In TOC = $639,038 71 2018 Inv. In TOC = $14,438 72 73 Net operating profit after taxes 74 2018 NOPAT EBIT 75 2018 NOPAT = $99,200 76 2018 NOPAT $59,520 77 78 Free cash flow 79 2018 FCF NOPAT 80 2018 FCF = $59,520 81 2018 FCF = $45,082 82 83 Return on invested capital 84 2018 ROIC NOPAT 85 2018 ROIC = $59,520 86 2018 ROIC = 9.3% 87 Fixed assets $315,000 + 2017 TOC $624,600 X X (1-T) (1.0.40) Net investment in operating capital $14,438 Total net operating capital $639.038 x100 Build a Model Read Type here to search o 63 2017 TOC NOWC Fixed assets 64 2017 TOC $309,600 + $315,000 65 2017 TOC = $624,600 66 67 Investment in total net operating capital 58 2018 2017 69 2018 Inv, In TOC = TOC TOC 70 2018 Inv. In TOC $639,038 $624,600 71 2018 Inv. In TOC = $14,438 72 73 Net operating profit after taxes 74 2018 NOPAT = EBIT (1-T) 75 2018 NOPAT = $99,200 (1-0.40) 76 2018 NOPAT = $59,520 77 78 Free cash flow 79 2018 FCF = NOPAT Net investment in operating capital 80 2018 FCF = $59,520 $14,438 81 2018 FCF = $45,082 82 83 Return on invested capital 84 2018 ROIC NOPAT Total net operating capital 85 2018 ROIC = $59,520 7 $639,038 x100 86 2018 ROIC 9.3% 87 88 b. Assume that there were 15 million shares outstanding at the end of the year, the year-end 89 closing stock price was $65 per share, and the after-tax cost of capital was 8%. Calculate EVA 90 and MVA for the most recent year. 91 92 Additional Input Data 93 Stock price per share $65.00 94 # of shares (in thousands) 15,000 95 After-tax cost of capital 8.0% 96 97 Market Value Added 98 MVA = Stock price X # of shares Total common equity 99 MVA = $65.00 X 15,000,000 $975,000 1001 MVA = $975,000 $544,538 101 MVA = $430,462 102 103 Economic Value Added 104 EVA = NOPAT (Operating Capiti X 105 EVA - After-tax cost of capital) $59.520 $661,500 X 8% 106 EVA = $52.920 $52,920 107 EVA = $6.600 Build a Model + Read HE Type here to search a. Using the financial statements shown below, calculate net operating working capital, total net operating capital, net operating profit after taxes, free cash flow, and return on invested capital for the most recent year. Lan & Chen Technologies: Income Statements for Year Ending December 31 (Thousands of Dollars) 2018 2017 0 Sales $945,000 $900,000 1 Expenses excluding depreciation and amortization 812 700 774.000 2 EBITDA $132,300 $126,000 3 Depreciation and amortization 33.100 31.500 4 EBIT $99,200 $94,500 5 Interest Expense 10.470 8.600 6 EBT 588,730 $85.900 7 Taxes (40%) 35.492 34 360 8 Net income $53,238 $51,540 9 0 Common dividends $43,300 $41,230 21 Addition to retained earnings $9.938 $10,310 22 23 Lan & Chen Technologies: December 31 Balance Sheets 24 (Thousands of Dollars) 25 Assets 2018 2017 25 Cash and cash equivalents $47,250 $45,000 27 Short-term investments 3.800 3,600 28 Accounts Receivable 283,500 270,000 29 Inventories 141.750 135.000 30 Total current assets $476,300 $453,600 31 Net fixed assets 330.750 315.000 32 Total assets $807,050 $768,600 33 34 Liabilities and equity 35 Accounts payable $94.500 $90,000 36 Accruals 47,250 45,000 37 Notes payable 26.262 9.000 38 Total current liabilities $168,012 $144,000 39 Long-term debt 94.500 90.000 40 Total liabilities $262.512 $234,000 41 Common stock 444,600 444,600 42 Retained Earnings 99.938 90.000 43 Total common equity $544.538 $534 600 44 Total liabilities and equity $807,050 $768,600 45 Key Input Data Tax rate 40% Net operating working capital Operating current 2018 NOWC = assets 2018 NOWC= $476,300 2018 NOWC = $308,288 Operating current liabilities $168,012 2017 2017 2017 NOWCE NOWC = NOWC = Operating current assets $453,600 $309,600 Operating current liabilities $144,000 Total net operating capital 2018 TOC = 2018 TOC = 2018 TOC = + NOWC $308,288 $639,038 Fixed assets $330,750 + + 2017 2017 2017 TOC = TOC = TOC = NOWC $309,600 $624,600 Fixed assets $315,000 + 5 - Investment in total net operating capital 2018 2018 Inv. In TOC = TOC 2018 Inv. In TOC = $639,038 2018 Inv. In TOC = $14,438 2017 TOC $624,600 (1-T) (1-0.40) Net operating profit after taxes 2018 NOPAT = EBIT 5 2018 NOPAT = $99,200 2018 NOPAT = $59,520 7 B Free cash flow 9 2018 FCF = NOPAT 0 2018 FCF = $59,520 1 2018 FCF = $45,082 2 3 Return on invested capital 4 2018 ROIC = NOPAT 5 2018 ROIC = $59,520 6 2018 ROIC = 9.3% Net investment in operating capital $14,438 Total net operating capital $639,038 x 100 b. Assume that there were 15 million shares outstanding at the end of the year, the year-end closing stock price was $65 per share, and the after-tax cost of capital was 8%. Calculate EVA and MVA for the most recent year. 1 Additional Input Data 3 Stock price per share $65.00 4 # of shares (in thousands) 15,000 5 After-tax cost of capital 8.0% 6 7 Market Value Added 8 MVA = Stock price # of shares Total common equity 09 MVA = $65.00 15,000,000 $975,000 00 MVA = $975,000 $544,538 01 MVA = $430,462 02 03 Economic Value Added 04 EVA = NOPAT (Operating Capite X After-tax cost of capital) EVA = $59,520 $661,500 8% 106 EVA = $52,920 $52,920 107 EVA $6,600 105 Ruildin Madal
