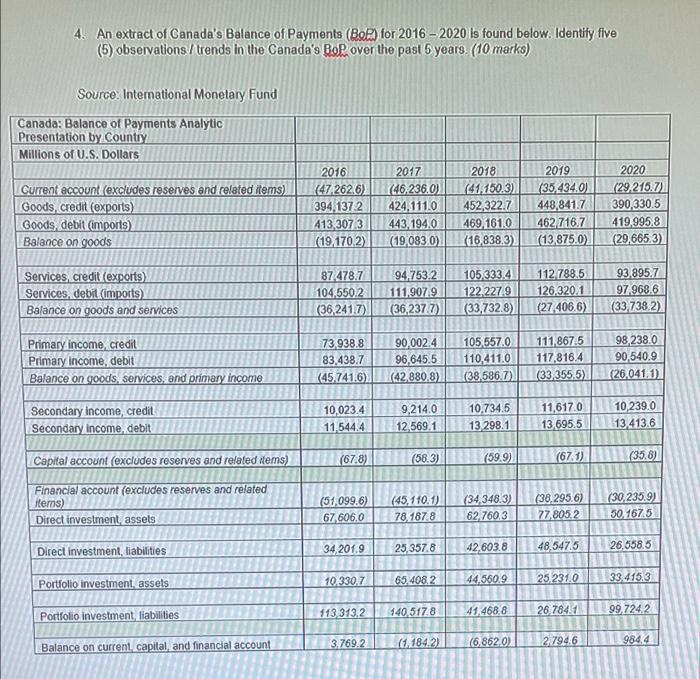
4. An extract of Canada's Balance of Payments (Bel) for 2016 - 2020 is found below. Identify five (5) observations / trends in the Canada's Bop over the past 5 years. (10 marks) Source: International Monetary Fund Canada: Balance of Payments Analytic Presentation by Country Millions of U.S. Dollars Current account (excludes reserves and related items) Goods, credit (exports) Goods, debit (imports) Balance on goods 2016 (47.262.6) 394,1372 413,3073 (19,1702) 2017 (46,236.0) 424,111.0 443 194.0 (19.083.0) 2018 (41.150.3) 452,322.7 469.161.0 (16,838.3) 2019 (35.434.0) 448,841.7 462 716.7 (13,875.0) 2020 (29 215.7) 390,330.5 419.9958 (29,665.3) Services, credit (exports) Services, debil (imports Balance on goods and services 87 478.7 104,550.2 (36,2417) 94,753.2 111,907.9 (36,2377) 105 333.4 122,2279 (33,732.8) 112788.5 126.320.1 (27 406.6) 93.895.7 97,968.6 (33738.2) Primary income, credit Primary income, debit Balance on goods, services, and primary income 73,938.8 83,438.7 (45,741.6) 90.002.4 96,645.5 (42.880.8) 105557.0 110,411.0 (38.686.7) 111 8675 117,816,4 (33,355,5) 98,238.0 90,540.9 (26.041.1) Secondary income, credit Secondary income, debit 10,023.4 115444 9,214.0 12 569.1 10,734.5 13 298.1 11,6170 13,695.5 10.239.0 13.413.6 (67.8) Capital account (excludes reserves and related items) (58.3) (59.9) (35.8) (67.1) Financial account (excludes reserves and related items) Direct investment, assels (51,099.6) 67 606.0 (45,110.1) 78. 1878 (34,348.3) 62,760.3 (38,295.6) 77 805 2 (30,235,9) 30.1675 Direct investment, liabilities 34,201.9 25,357.8 42.603.8 48,547.5 26,658.5 10.330,7 65,408.2 Portfolio investment, assets 44.560.9 25.231.0 33.4153 113 313.2 140,517.8 Portfolio investment, liabilities 41.468.8 26.7841 99.7242 3.769. (1.184.2) Balance on current capital and financial account (6,862.0) 2 7946 9844 4. An extract of Canada's Balance of Payments (Bel) for 2016 - 2020 is found below. Identify five (5) observations / trends in the Canada's Bop over the past 5 years. (10 marks) Source: International Monetary Fund Canada: Balance of Payments Analytic Presentation by Country Millions of U.S. Dollars Current account (excludes reserves and related items) Goods, credit (exports) Goods, debit (imports) Balance on goods 2016 (47.262.6) 394,1372 413,3073 (19,1702) 2017 (46,236.0) 424,111.0 443 194.0 (19.083.0) 2018 (41.150.3) 452,322.7 469.161.0 (16,838.3) 2019 (35.434.0) 448,841.7 462 716.7 (13,875.0) 2020 (29 215.7) 390,330.5 419.9958 (29,665.3) Services, credit (exports) Services, debil (imports Balance on goods and services 87 478.7 104,550.2 (36,2417) 94,753.2 111,907.9 (36,2377) 105 333.4 122,2279 (33,732.8) 112788.5 126.320.1 (27 406.6) 93.895.7 97,968.6 (33738.2) Primary income, credit Primary income, debit Balance on goods, services, and primary income 73,938.8 83,438.7 (45,741.6) 90.002.4 96,645.5 (42.880.8) 105557.0 110,411.0 (38.686.7) 111 8675 117,816,4 (33,355,5) 98,238.0 90,540.9 (26.041.1) Secondary income, credit Secondary income, debit 10,023.4 115444 9,214.0 12 569.1 10,734.5 13 298.1 11,6170 13,695.5 10.239.0 13.413.6 (67.8) Capital account (excludes reserves and related items) (58.3) (59.9) (35.8) (67.1) Financial account (excludes reserves and related items) Direct investment, assels (51,099.6) 67 606.0 (45,110.1) 78. 1878 (34,348.3) 62,760.3 (38,295.6) 77 805 2 (30,235,9) 30.1675 Direct investment, liabilities 34,201.9 25,357.8 42.603.8 48,547.5 26,658.5 10.330,7 65,408.2 Portfolio investment, assets 44.560.9 25.231.0 33.4153 113 313.2 140,517.8 Portfolio investment, liabilities 41.468.8 26.7841 99.7242 3.769. (1.184.2) Balance on current capital and financial account (6,862.0) 2 7946 9844


