Answered step by step
Verified Expert Solution
Link Copied!

Question

1 Approved Answer

4. Application: Demand elasticity and agriculture The following graph illustrates the market for almonds. It plots the monthly supply of almonds and the monthly demand
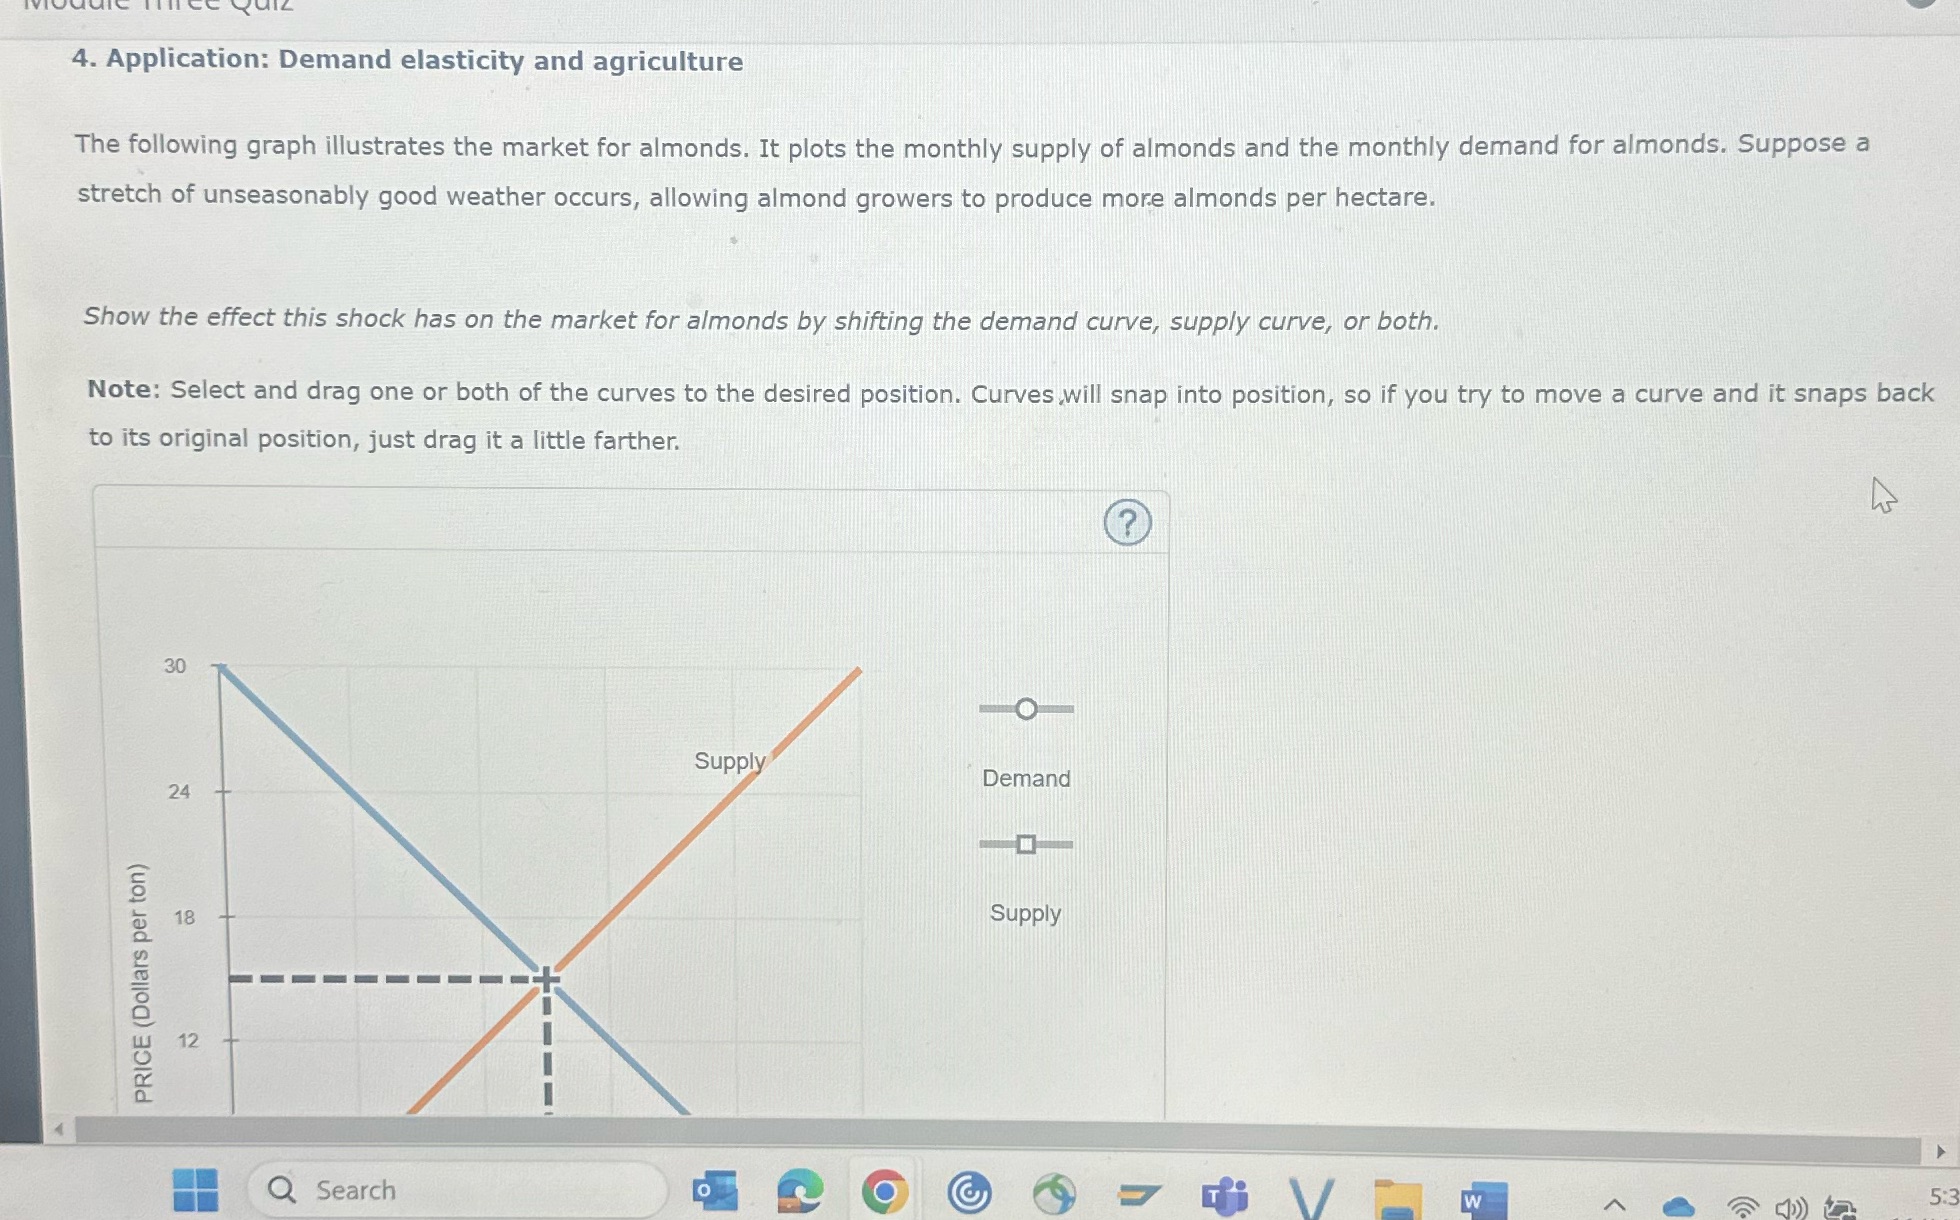
image text in transcribed
4. Application: Demand elasticity and agriculture The following graph illustrates the market for almonds. It plots the monthly supply of almonds and the monthly demand for almonds. Suppose a stretch of unseasonably good weather occurs, allowing almond growers to produce more almonds per hectare. Show the effect this shock has on the market for almonds by shifting the demand curve, supply curve, or both. Note: Select and drag one or both of the curves to the desired position. Curves.will snap into position, so if you try to move a curve and it snaps back to its original position, just drag it a little farther. 30 O Supply Demand 24 18 Supply PRICE (Dollars per ton) 12 Q Search V w 5:3

Step by Step Solution

There are 3 Steps involved in it

Step: 1

blur-text-image

Get Instant Access to Expert-Tailored Solutions

See step-by-step solutions with expert insights and AI powered tools for academic success

Step: 2

blur-text-image

Step: 3

blur-text-image

Ace Your Homework with AI

Get the answers you need in no time with our AI-driven, step-by-step assistance

Get Started

Recommended Textbook for

Econometric Analysis

Authors: William H. Greene

5th Edition

130661899, 978-0130661890

More Books

Students also viewed these Economics questions

Question

=+c. Explain what effect BSBs action will have on other banks.

Answered: 1 week ago

Question

When is it appropriate to use a root cause analysis

Answered: 1 week ago