Answered step by step
Verified Expert Solution
Question
1 Approved Answer
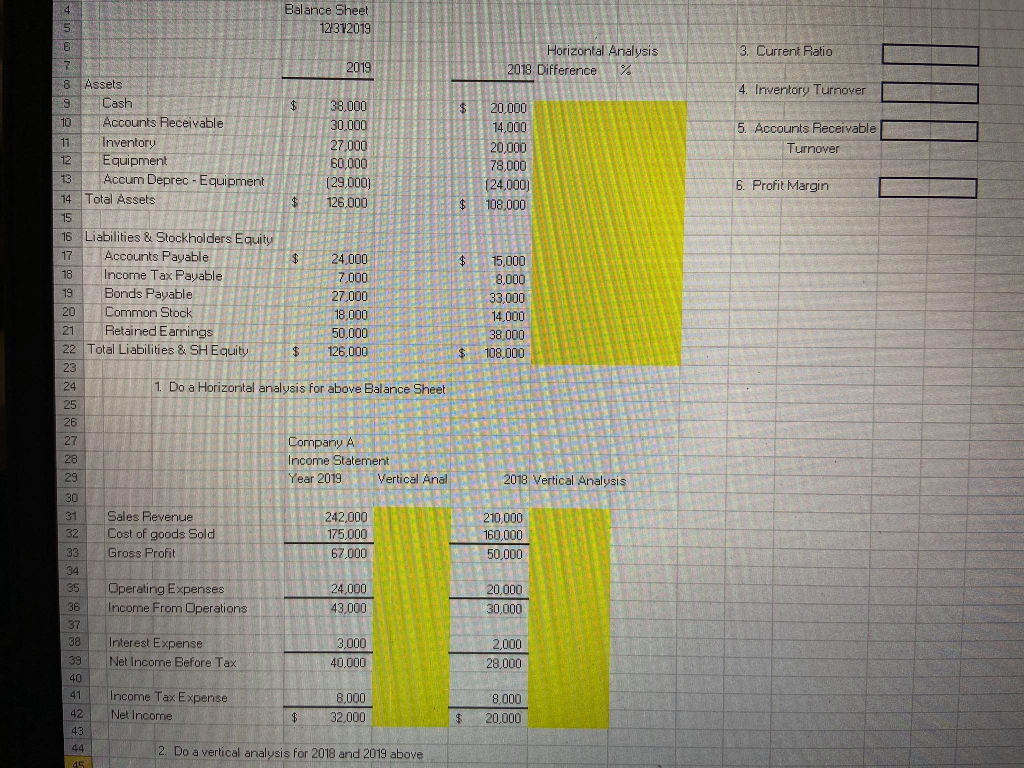
4 Balance Sheet 12/312019 5 6 3. Current Ratio Horizontal Analysis 2018 Difference % 4. Inventory Turnover $ 5. Accounts Receivable Turnover 20.000 14.000 20,000
Step by Step Solution
There are 3 Steps involved in it
Step: 1

Get Instant Access to Expert-Tailored Solutions
See step-by-step solutions with expert insights and AI powered tools for academic success
Step: 2

Step: 3
Ace Your Homework with AI
Get the answers you need in no time with our AI-driven, step-by-step assistance
Get Started