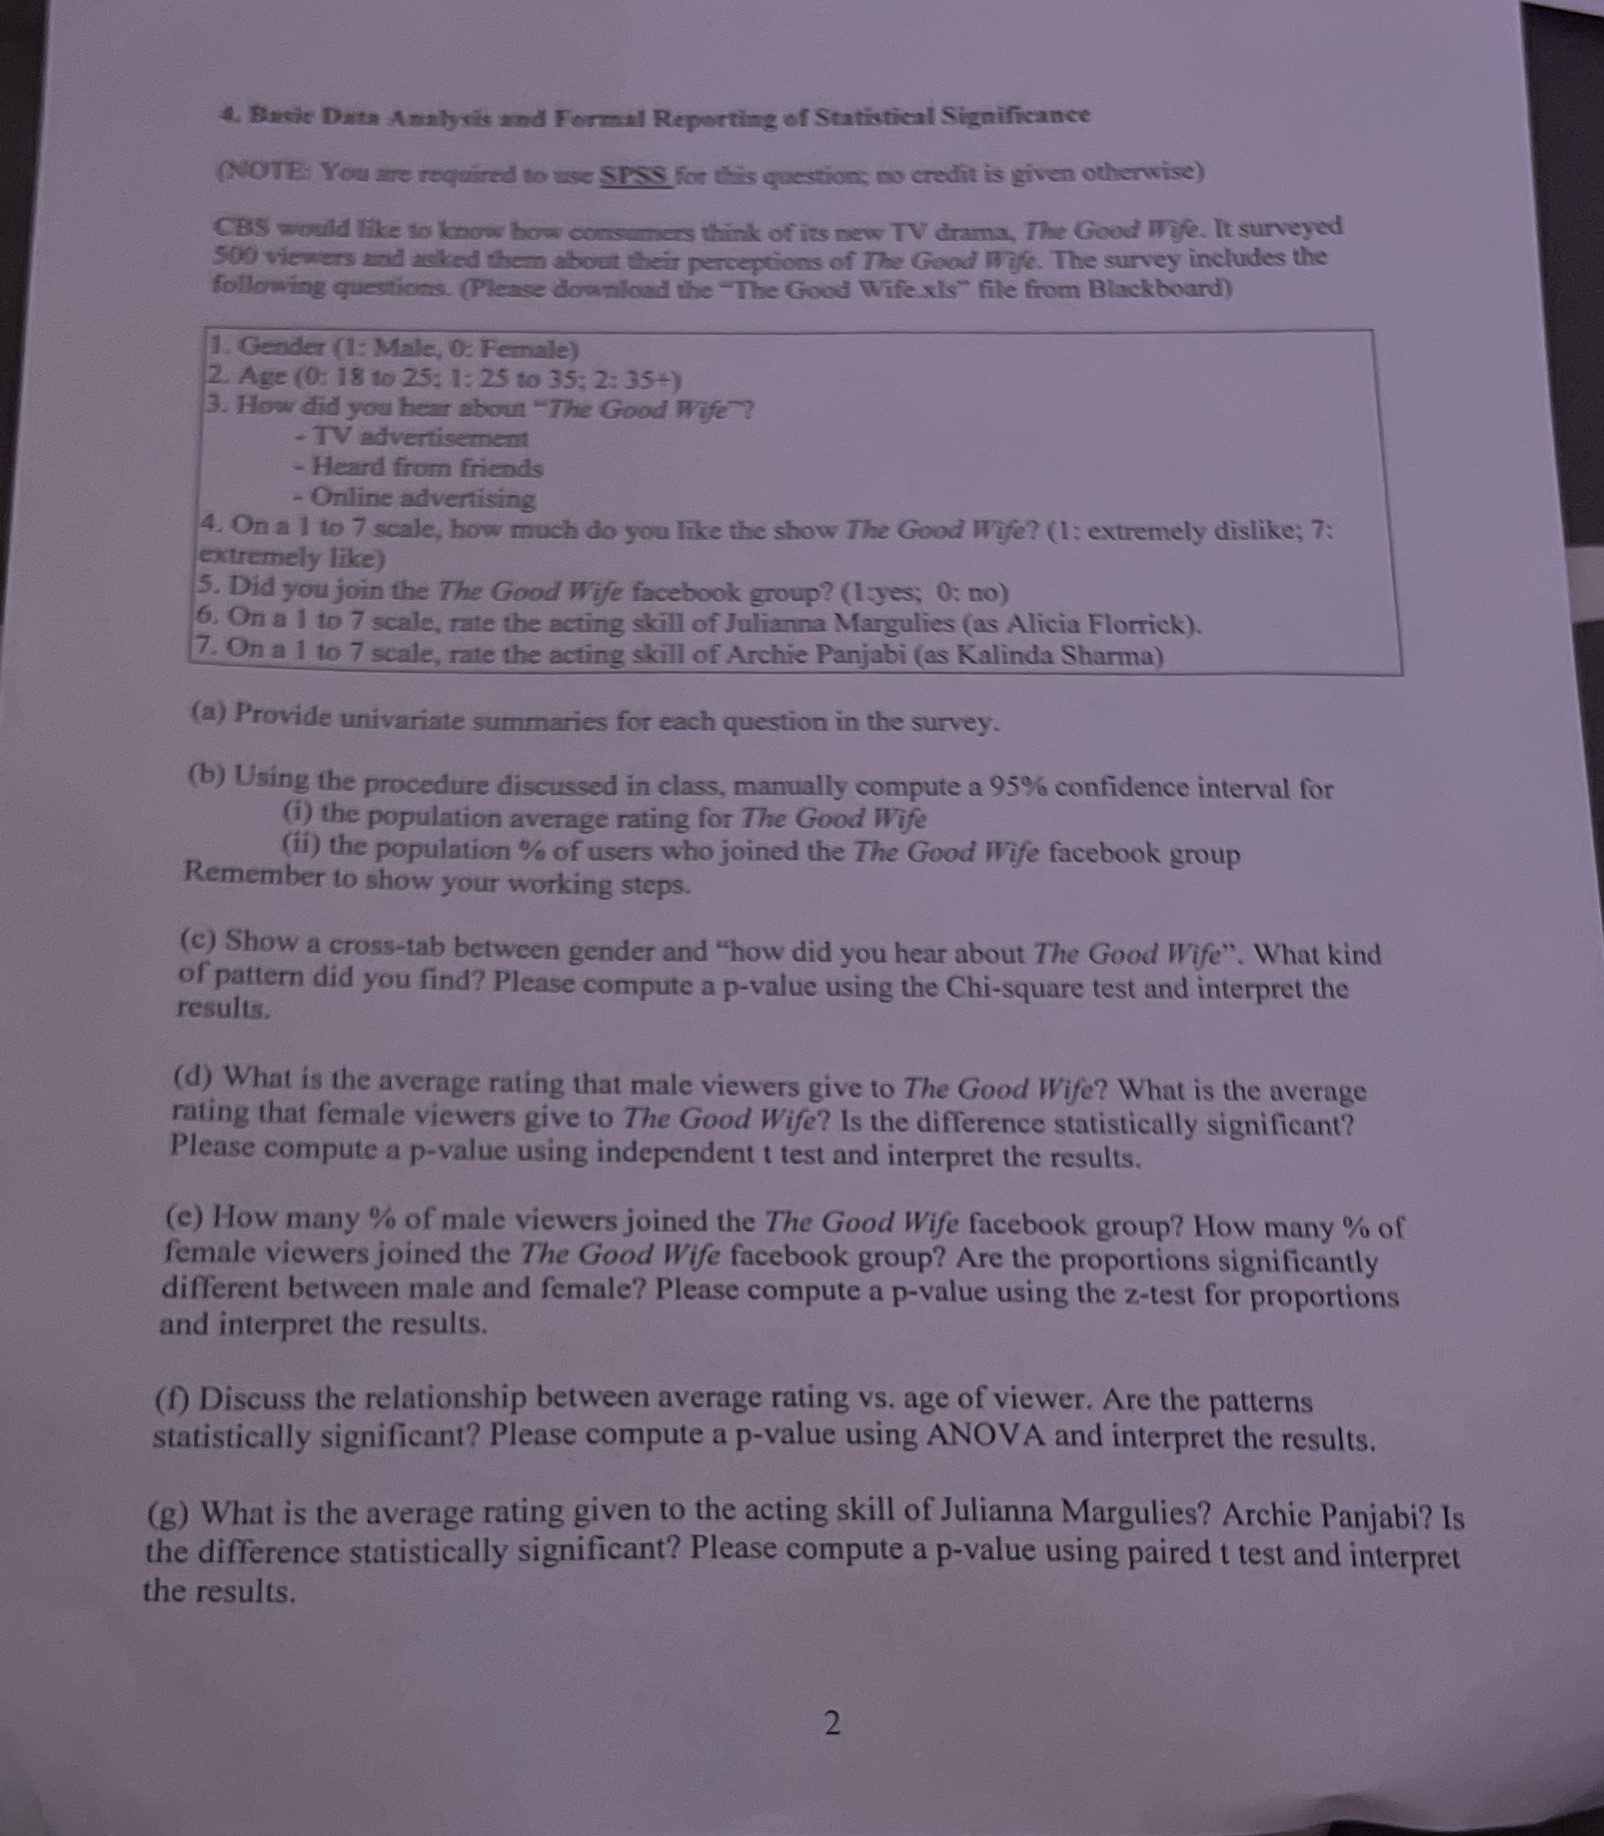
4. Basic Data Analysis and Formal Reporting of Statistical Significance (NOTE: You are required to use SPSS for this question; no credit is given otherwise) CBS would like to know how consumers think of its new TV drama, The Good Wife. It surveyed 500 viewers and asked them about their perceptions of The Good Wife. The survey includes the following ques tions. (Please download the "The Good Wife xIs" file from Blackboard) 1. Gender (1: Male, 0: Female) 2. Age (0: 18 to 25: 1: 25 to 35; 2: 35+) 3. How did you hear about "The Good Wife ? - TV advertisement - Heard from friends - Online advertising 4. On a 1 to 7 scale, how much do you like the show The Good Wife? (1: extremely dislike; 7: extremely like) 5. Did you join the The Good Wife facebook group? (1:yes; 0: no) 6. On a 1 to 7 scale, rate the acting skill of Julianna Margulies (as Alicia Florrick). 7. On a 1 to 7 scale, rate the acting skill of Archie Panjabi (as Kalinda Sharma) (a) Provide univariate summaries for each question in the survey. (b) Using the procedure discussed in class, manually compute a 95% confidence interval for (i) the population average rating for The Good Wife (ii) the population % of users who joined the The Good Wife facebook group Remember to show your working steps. (c) Show a cross-tab between gender and "how did you hear about The Good Wife". What kind of pattern did you find? Please compute a p-value using the Chi-square test and interpret the results. (d) What is the average rating that male viewers give to The Good Wife? What is the average rating that female viewers give to The Good Wife? Is the difference statistically significant? Please compute a p-value using independent t test and interpret the results. (e) How many % of male viewers joined the The Good Wife facebook group? How many % of female viewers joined the The Good Wife facebook group? Are the proportions significantly different between male and female? Please compute a p-value using the z-test for proportions and interpret the results. (f) Discuss the relationship between average rating vs. age of viewer. Are the patterns statistically significant? Please compute a p-value using ANOVA and interpret the results. (g) What is the average rating given to the acting skill of Julianna Margulies? Archie Panjabi? Is the difference statistically significant? Please compute a p-value using paired t test and interpret the results. 2


