Answered step by step
Verified Expert Solution
Question
1 Approved Answer
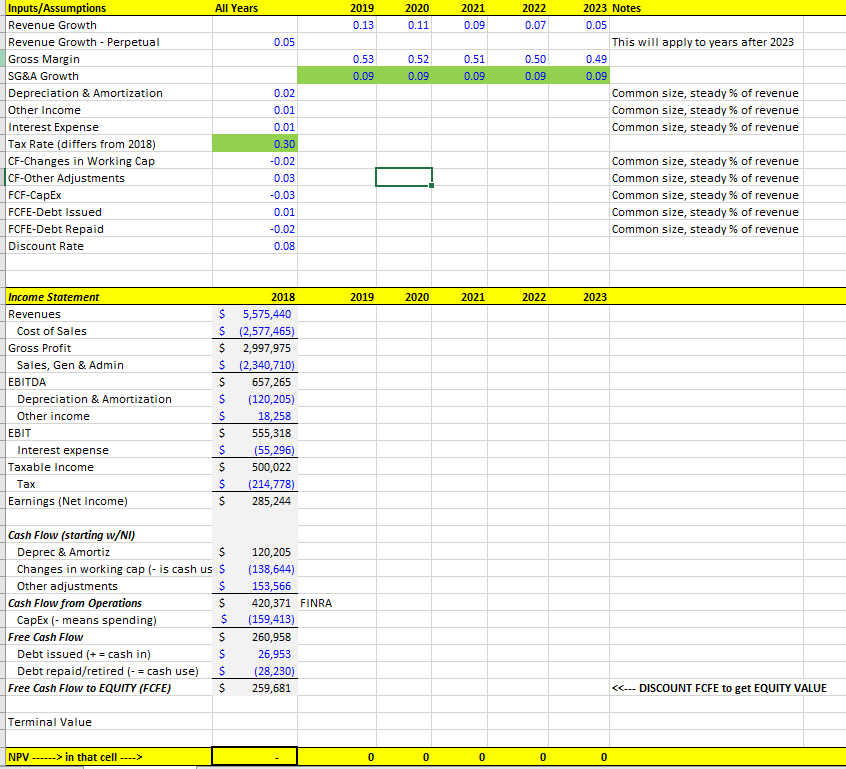
4. Beyond 2023, it is difficult to forecast LEVI. Depending on the industry, we can sometimes comfortably forecast 3, 5, 7, or perhaps 10 years.
 4. Beyond 2023, it is difficult to forecast LEVI. Depending on the industry, we can sometimes comfortably forecast 3, 5, 7, or perhaps 10 years. LEVI is somewhat predictable, but for simplicity, we will forecast 5 years.
a. Take your FCFE from 2023 and grow it by 5% to 2024. Assume it grows at 5% every year thereafter.
b. Using the cost of capital (given in the spreadsheet), this looks like growing perpetuity where r is the discount rate and g is this perpetual growth rate.
c. This is the terminal value.
All Years 2019 0.13 2020 0.11 2022 0.07 0.05 0.53 0.09 0.52 0.090 2023 Notes 0.05 This will apply to years after 2023 0.49 0.09 Common size, steady % of revenue Common size, steady % of revenue Common size, steady % of revenue .09 Inputs/Assumptions Revenue Growth Revenue Growth - Perpetual Gross Margin SG&A Growth Depreciation & Amortization Other Income Interest Expense Tax Rate (differs from 2018) CF-Changes in Working Cap CF-Other Adjustments FCF-Capex FCFE-Debt Issued FCFE-Debt Repaid Discount Rate 0.09 0.02 0.01 0.01 0.30 -0.02 0.03 -0.03 0.01 -0.02 0.08 Common size, steady % of revenue Common size, steady % of revenue Common size, steady % of revenue Common size, steady % of revenue Common size, steady % of revenue 2019 2020 2021 2022 2023 $ $ $ $ $ Income Statement Revenues Cost of Sales Gross Profit Sales, Gen & Admin EBITDA Depreciation & Amortization Other income EBIT Interest expense Taxable income Tax Earnings (Net Income) $ 2018 5,575,440 (2,577,465) 2,997,975 (2,340,710) 657,265 (120,205) 18,258 555,318 (55,296) 500,022 (214,778) 285,244 $ $ $ $ Cash Flow (starting w/NI) Deprec & Amortiz $ Changes in working cap (- is cash us $ Other adjustments Cash Flow from Operations $ CapEx (- means spending) $ Free Cash Flow $ Debt issued (+= cash in) $ Debt repaid/retired (- = cash use) $ Free Cash Flow to EQUITY (FCFE) $ 120,205 (138,644) 153,566 420,371 FINRA (159,413) 260,958 26,953 (28,230) 259,681 in that cell ----> 0 0 0 0 0 All Years 2019 0.13 2020 0.11 2022 0.07 0.05 0.53 0.09 0.52 0.090 2023 Notes 0.05 This will apply to years after 2023 0.49 0.09 Common size, steady % of revenue Common size, steady % of revenue Common size, steady % of revenue .09 Inputs/Assumptions Revenue Growth Revenue Growth - Perpetual Gross Margin SG&A Growth Depreciation & Amortization Other Income Interest Expense Tax Rate (differs from 2018) CF-Changes in Working Cap CF-Other Adjustments FCF-Capex FCFE-Debt Issued FCFE-Debt Repaid Discount Rate 0.09 0.02 0.01 0.01 0.30 -0.02 0.03 -0.03 0.01 -0.02 0.08 Common size, steady % of revenue Common size, steady % of revenue Common size, steady % of revenue Common size, steady % of revenue Common size, steady % of revenue 2019 2020 2021 2022 2023 $ $ $ $ $ Income Statement Revenues Cost of Sales Gross Profit Sales, Gen & Admin EBITDA Depreciation & Amortization Other income EBIT Interest expense Taxable income Tax Earnings (Net Income) $ 2018 5,575,440 (2,577,465) 2,997,975 (2,340,710) 657,265 (120,205) 18,258 555,318 (55,296) 500,022 (214,778) 285,244 $ $ $ $ Cash Flow (starting w/NI) Deprec & Amortiz $ Changes in working cap (- is cash us $ Other adjustments Cash Flow from Operations $ CapEx (- means spending) $ Free Cash Flow $ Debt issued (+= cash in) $ Debt repaid/retired (- = cash use) $ Free Cash Flow to EQUITY (FCFE) $ 120,205 (138,644) 153,566 420,371 FINRA (159,413) 260,958 26,953 (28,230) 259,681 in that cell ----> 0 0 0 0 0Step by Step Solution
There are 3 Steps involved in it
Step: 1

Get Instant Access to Expert-Tailored Solutions
See step-by-step solutions with expert insights and AI powered tools for academic success
Step: 2

Step: 3

Ace Your Homework with AI
Get the answers you need in no time with our AI-driven, step-by-step assistance
Get Started


