Answered step by step
Verified Expert Solution
Link Copied!

Question

1 Approved Answer

4. Click on the pressure gauge to move it toward the water. Measure the pressure in the water at every 0.50 m from the surface
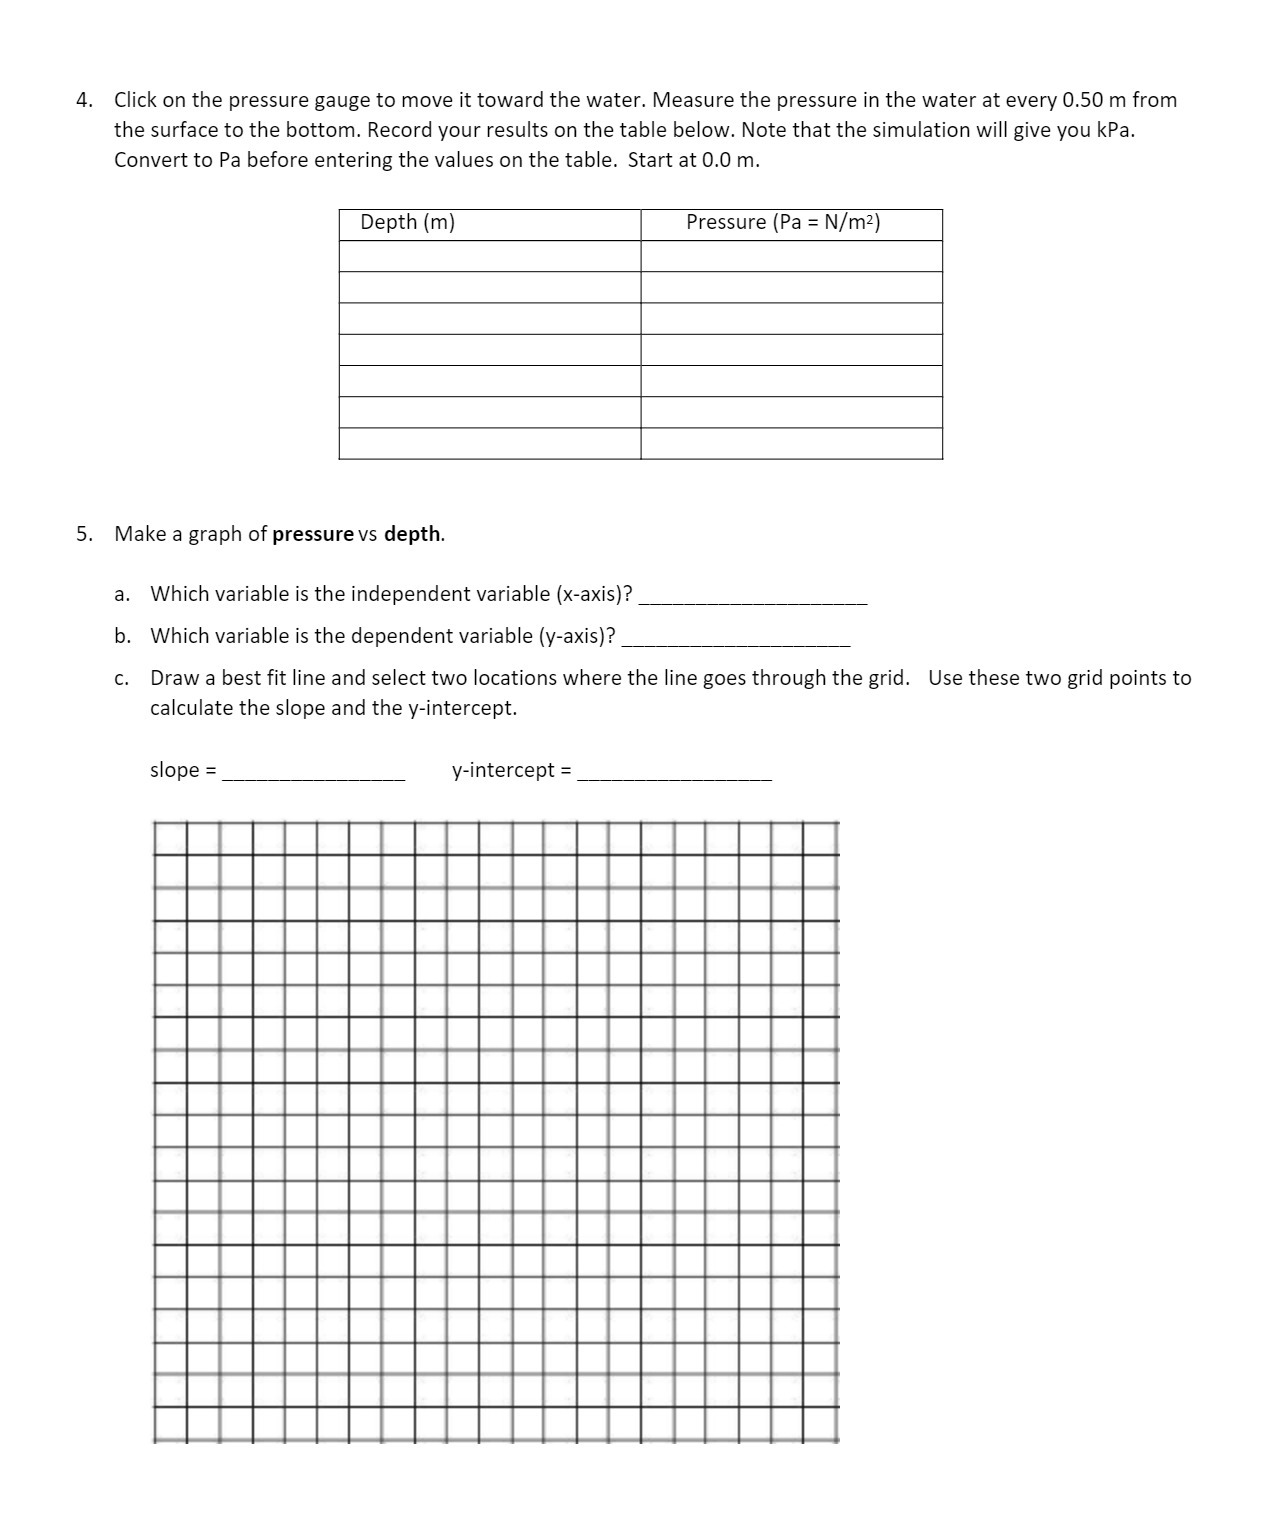
image text in transcribed
4. Click on the pressure gauge to move it toward the water. Measure the pressure in the water at every 0.50 m from the surface to the bottom. Record your results on the table below. Note that the simulation will give you kPa. Convert to Pa before entering the values on the table. Start at 0.0 m. Depth (m) Pressure (Pa = N/mz} 5. Make a graph of pressurevs depth. a. Which variable is the independent variable (xaxis}? b. Which variable is the dependent variable (yaxis}? c. Draw a best fit line and select two locations where the line goes through the grid. Use these two grid points to calculate the slope and the y-intercept. slope = y-interce pt =

Step by Step Solution

There are 3 Steps involved in it

Step: 1

blur-text-image

Get Instant Access to Expert-Tailored Solutions

See step-by-step solutions with expert insights and AI powered tools for academic success

Step: 2

blur-text-image

Step: 3

blur-text-image

Ace Your Homework with AI

Get the answers you need in no time with our AI-driven, step-by-step assistance

Get Started

Recommended Textbook for

College Physics

Authors: Raymond A. Serway, Jerry S. Faughn, Chris Vuille, Charles A. Bennett

7th Edition

9780534997236, 495113697, 534997236, 978-0495113690

More Books

Students also viewed these Physics questions

Question

2. What is Tobins q, and what does it have to do with investment?

Answered: 1 week ago