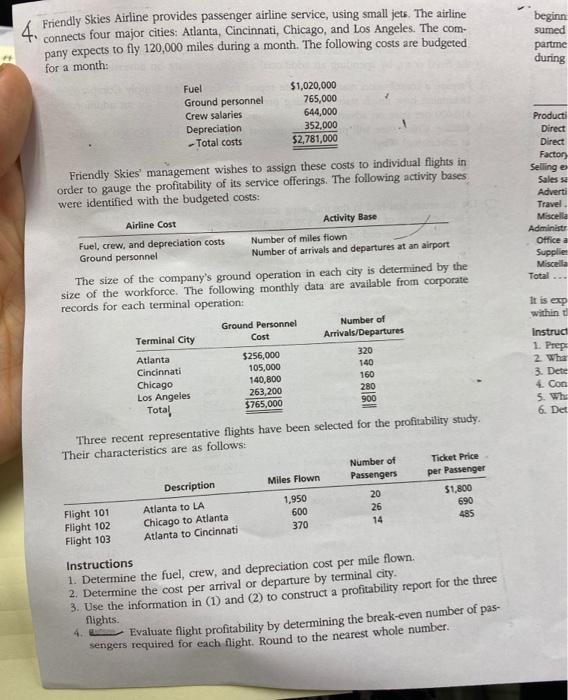
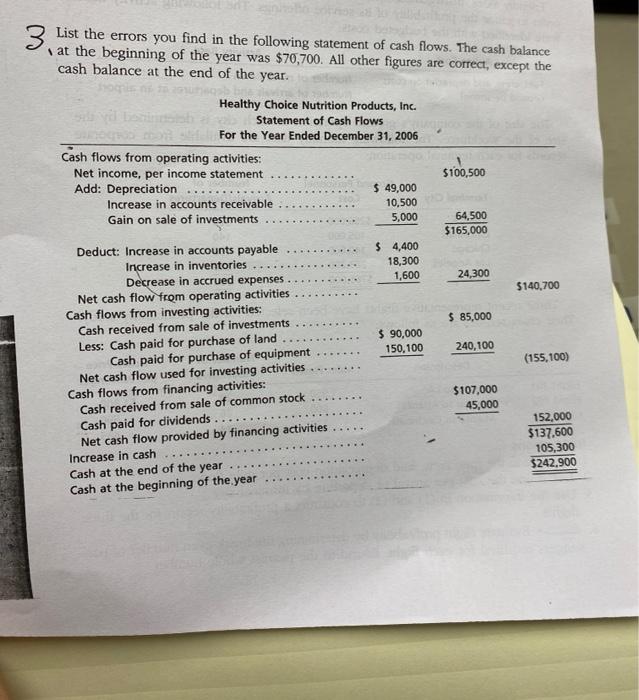
4. connects four major cities: Atlanta, Cincinnati, Chicago, and Los Angeles. The com- pany expects to fly 120,000 miles during a month. The following costs are budgeted beginn sumed partme during for a month Fuel Ground personnel Crew salaries Depreciation -Total costs $1,020,000 765,000 644,000 352.000 $2,781,000 Friendly Skies management wishes to assign these costs to individual flights in order to gauge the profitability of its service offerings. The following activity bases were identified with the budgeted costs: Producti Direct Direct Factor Selling e Sales Adverti Travel Miscella Administr Office a Supplier Miscella Total It is exp within 320 Airline Cost Activity Base Fuel, crew, and depreciation costs Number of miles flown Ground personnel Number of arrivals and departures at an airport The size of the company's ground operation in each city is determined by the size of the workforce. The following monthly data are available from corporate records for each terminal operation: Ground Personnel Number of Terminal City Cost Arrivals/Departures Atlanta $256,000 Cincinnati 105,000 140 Chicago 140,000 160 Los Angeles 263,200 280 Total $765,000 900 Three recent representative flights have been selected for the profitability study. Their characteristics are as follows: Number of Ticket Price Description Miles Flown Passengers per Passenger 20 $1,800 Flight 101 Atlanta to LA 26 690 Flight 102 Chicago to Atlanta 14 370 485 Flight 103 Atlanta to Cincinnati Instruct 1. Prep 2. Wha 3. Dete 4. Con 5. Whi 6. Det 1,950 600 Instructions 1. Determine the fuel, crew, and depreciation cost per mile flown. 2. Determine the cost per arrival or departure by terminal city. 3. Use the information in (1) and (2) to construct a profitability report for the three flights. 4. Evaluate flight profitability by determining the break-even number of pas- sengers required for each flight. Round to the nearest whole number. 3. List the errors you find in the following statement of cash flows. The cash balance at the beginning of the year was $70,700. All other figures are correct, except the cash balance at the end of the year. Healthy Choice Nutrition Products, Inc. Statement of Cash Flows For the Year Ended December 31, 2006 Cash flows from operating activities: Net income, per income statement Add: Depreciation $ 49,000 Increase in accounts receivable 10,500 Gain on sale of investments 5,000 $100,500 64,500 $165,000 $ 4,400 18,300 1,600 24,300 $140,700 $ 85,000 $ 90,000 150,100 240,100 (155,100) Deduct: Increase in accounts payable Increase in inventories Decrease in accrued expenses Net cash flow from operating activities Cash flows from investing activities: Cash received from sale of investments Less: Cash paid for purchase of land Cash paid for purchase of equipment Net cash flow used for investing activities Cash flows from financing activities: Cash received from sale of common stock Cash paid for dividends Net cash flow provided by financing activities Increase in cash Cash at the end of the year Cash at the beginning of the year $107.000 45,000 152.000 $137,600 105,300 $242.900 4. connects four major cities: Atlanta, Cincinnati, Chicago, and Los Angeles. The com- pany expects to fly 120,000 miles during a month. The following costs are budgeted beginn sumed partme during for a month Fuel Ground personnel Crew salaries Depreciation -Total costs $1,020,000 765,000 644,000 352.000 $2,781,000 Friendly Skies management wishes to assign these costs to individual flights in order to gauge the profitability of its service offerings. The following activity bases were identified with the budgeted costs: Producti Direct Direct Factor Selling e Sales Adverti Travel Miscella Administr Office a Supplier Miscella Total It is exp within 320 Airline Cost Activity Base Fuel, crew, and depreciation costs Number of miles flown Ground personnel Number of arrivals and departures at an airport The size of the company's ground operation in each city is determined by the size of the workforce. The following monthly data are available from corporate records for each terminal operation: Ground Personnel Number of Terminal City Cost Arrivals/Departures Atlanta $256,000 Cincinnati 105,000 140 Chicago 140,000 160 Los Angeles 263,200 280 Total $765,000 900 Three recent representative flights have been selected for the profitability study. Their characteristics are as follows: Number of Ticket Price Description Miles Flown Passengers per Passenger 20 $1,800 Flight 101 Atlanta to LA 26 690 Flight 102 Chicago to Atlanta 14 370 485 Flight 103 Atlanta to Cincinnati Instruct 1. Prep 2. Wha 3. Dete 4. Con 5. Whi 6. Det 1,950 600 Instructions 1. Determine the fuel, crew, and depreciation cost per mile flown. 2. Determine the cost per arrival or departure by terminal city. 3. Use the information in (1) and (2) to construct a profitability report for the three flights. 4. Evaluate flight profitability by determining the break-even number of pas- sengers required for each flight. Round to the nearest whole number. 3. List the errors you find in the following statement of cash flows. The cash balance at the beginning of the year was $70,700. All other figures are correct, except the cash balance at the end of the year. Healthy Choice Nutrition Products, Inc. Statement of Cash Flows For the Year Ended December 31, 2006 Cash flows from operating activities: Net income, per income statement Add: Depreciation $ 49,000 Increase in accounts receivable 10,500 Gain on sale of investments 5,000 $100,500 64,500 $165,000 $ 4,400 18,300 1,600 24,300 $140,700 $ 85,000 $ 90,000 150,100 240,100 (155,100) Deduct: Increase in accounts payable Increase in inventories Decrease in accrued expenses Net cash flow from operating activities Cash flows from investing activities: Cash received from sale of investments Less: Cash paid for purchase of land Cash paid for purchase of equipment Net cash flow used for investing activities Cash flows from financing activities: Cash received from sale of common stock Cash paid for dividends Net cash flow provided by financing activities Increase in cash Cash at the end of the year Cash at the beginning of the year $107.000 45,000 152.000 $137,600 105,300 $242.900


