Question
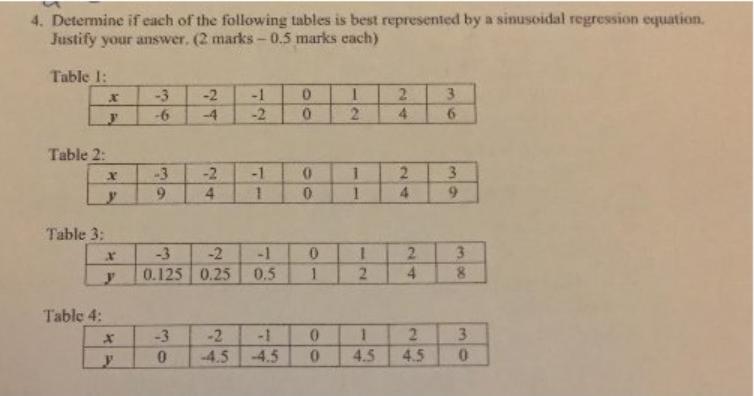
4. Determine if each of the following tables is best represented by a sinusoidal regression equation. Justify your answer. (2 marks-0.5 marks each) Table

4. Determine if each of the following tables is best represented by a sinusoidal regression equation. Justify your answer. (2 marks-0.5 marks each) Table 1: X -3 -6 9 24 -2 -1 0 I 2 3 -4 -2 0 2 4 6 Table 2: X -3 y 9 Table 3: Table 4: 24 -1 1 0 00 1 24 9 39 X -3 -2 -1 0 I 2 3 y 0.125 0.25 0.5 1 2 4 00 8 X -3 -2 -1 0 -4.5 -4.5 010 1 2. 0 4.5 4.5 30 0
Step by Step Solution
There are 3 Steps involved in it
Step: 1

Get Instant Access to Expert-Tailored Solutions
See step-by-step solutions with expert insights and AI powered tools for academic success
Step: 2

Step: 3

Ace Your Homework with AI
Get the answers you need in no time with our AI-driven, step-by-step assistance
Get StartedRecommended Textbook for
Modern Principles of Economics
Authors: Tyler Cowen, Alex Tabarrok
3rd edition
1429278390, 978-1429278416, 1429278412, 978-1429278393
Students also viewed these Mathematics questions
Question
Answered: 1 week ago
Question
Answered: 1 week ago
Question
Answered: 1 week ago
Question
Answered: 1 week ago
Question
Answered: 1 week ago
Question
Answered: 1 week ago
Question
Answered: 1 week ago
Question
Answered: 1 week ago
Question
Answered: 1 week ago
Question
Answered: 1 week ago
Question
Answered: 1 week ago
Question
Answered: 1 week ago
Question
Answered: 1 week ago
Question
Answered: 1 week ago
Question
Answered: 1 week ago
Question
Answered: 1 week ago
Question
Answered: 1 week ago
Question
Answered: 1 week ago
Question
Answered: 1 week ago
Question
Answered: 1 week ago
Question
Answered: 1 week ago
Question
Answered: 1 week ago
View Answer in SolutionInn App


