

Question: 4. Draw a Gantt chart that shows the completion times for each process using first- come, first served (FCFS) CPU scheduling. Calculate the average
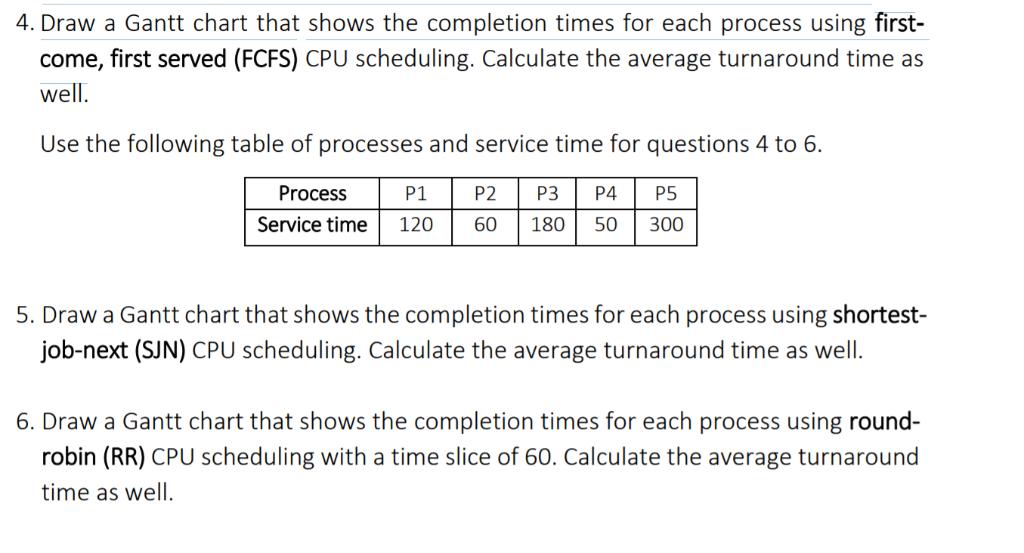
4. Draw a Gantt chart that shows the completion times for each process using first- come, first served (FCFS) CPU scheduling. Calculate the average turnaround time as well. Use the following table of processes and service time for questions 4 to 6. Process Service time P1 P2 P3 P4 P5 120 60 180 50 300 5. Draw a Gantt chart that shows the completion times for each process using shortest- job-next (SJN) CPU scheduling. Calculate the average turnaround time as well. 6. Draw a Gantt chart that shows the completion times for each process using round- robin (RR) CPU scheduling with a time slice of 60. Calculate the average turnaround time as well.
Step by Step Solution
3.30 Rating (150 Votes )
There are 3 Steps involved in it
I can provide you with the completion times and average turnaround time for each scheduling algorith... View full answer

Get step-by-step solutions from verified subject matter experts