Answered step by step
Verified Expert Solution
Link Copied!

Question

1 Approved Answer

4. Draw the Gantt chart and calculate average waiting time using Round Robin scheduler. The time quantum is 4. Use the following table. 6 5.
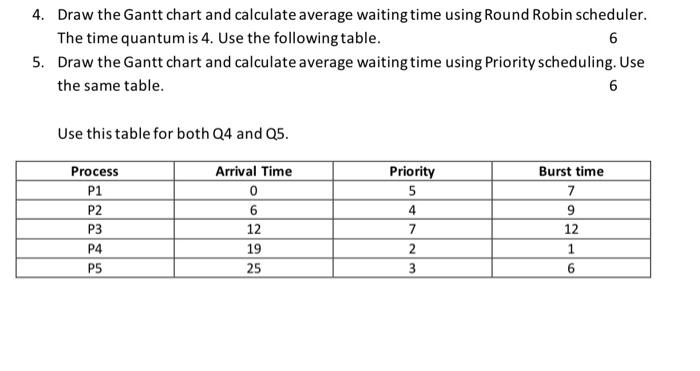
image text in transcribed
4. Draw the Gantt chart and calculate average waiting time using Round Robin scheduler. The time quantum is 4. Use the following table. 6 5. Draw the Gantt chart and calculate average waiting time using Priority scheduling. Use the same table. 6 Use this table for both Q4 and 25. Process P1 P2 P3 P4 PS Arrival Time 0 6 12 19 25 Priority 5 4 7 2 3 Burst time 7 9 12 1 6

Step by Step Solution

There are 3 Steps involved in it

Step: 1

blur-text-image

Get Instant Access to Expert-Tailored Solutions

See step-by-step solutions with expert insights and AI powered tools for academic success

Step: 2

blur-text-image_2

Step: 3

blur-text-image_3

Ace Your Homework with AI

Get the answers you need in no time with our AI-driven, step-by-step assistance

Get Started

Recommended Textbook for

Oracle Database Foundations Technology Fundamentals For IT Success

Authors: Bob Bryla

1st Edition

0782143725, 9780782143720

More Books

Students also viewed these Databases questions

Question

What do you wish you did more of?

Answered: 1 week ago

Question

Question What is a Roth 401(k) feature?

Answered: 1 week ago

Question

Question Can employees make contributions to a profit sharing plan?

Answered: 1 week ago