Answered step by step
Verified Expert Solution
Link Copied!

Question

1 Approved Answer

4. Draw the Gantt chart and calculate average waiting time using Round Robin scheduler. The time quantum is 3. Use the following table. Use the
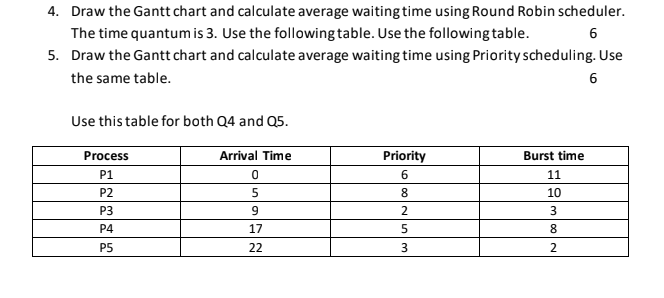
image text in transcribed

4. Draw the Gantt chart and calculate average waiting time using Round Robin scheduler. The time quantum is 3. Use the following table. Use the following table. 6 5. Draw the Gantt chart and calculate average waiting time using Priority scheduling. Use the same table. 6 Use this table for both Q4 and 25. Process P1 Priority 6 P2 Arrival Time 0 5 9 17 22 Burst time 11 10 3 8 P3 P4 P5 8 2 5 ||| W 3 2

Step by Step Solution

There are 3 Steps involved in it

Step: 1

blur-text-image

Get Instant Access to Expert-Tailored Solutions

See step-by-step solutions with expert insights and AI powered tools for academic success

Step: 2

blur-text-image

Step: 3

blur-text-image

Ace Your Homework with AI

Get the answers you need in no time with our AI-driven, step-by-step assistance

Get Started

Recommended Textbook for

Seven NoSQL Databases In A Week Get Up And Running With The Fundamentals And Functionalities Of Seven Of The Most Popular NoSQL Databases

Authors: Aaron Ploetz ,Devram Kandhare ,Sudarshan Kadambi ,Xun Wu

1st Edition

1787288862, 978-1787288867

More Books

Students also viewed these Databases questions

Question

=+2 Why are so many countries bothered by their brain drains?

Answered: 1 week ago