

Answered step by step
Verified Expert Solution
Question
1 Approved Answer
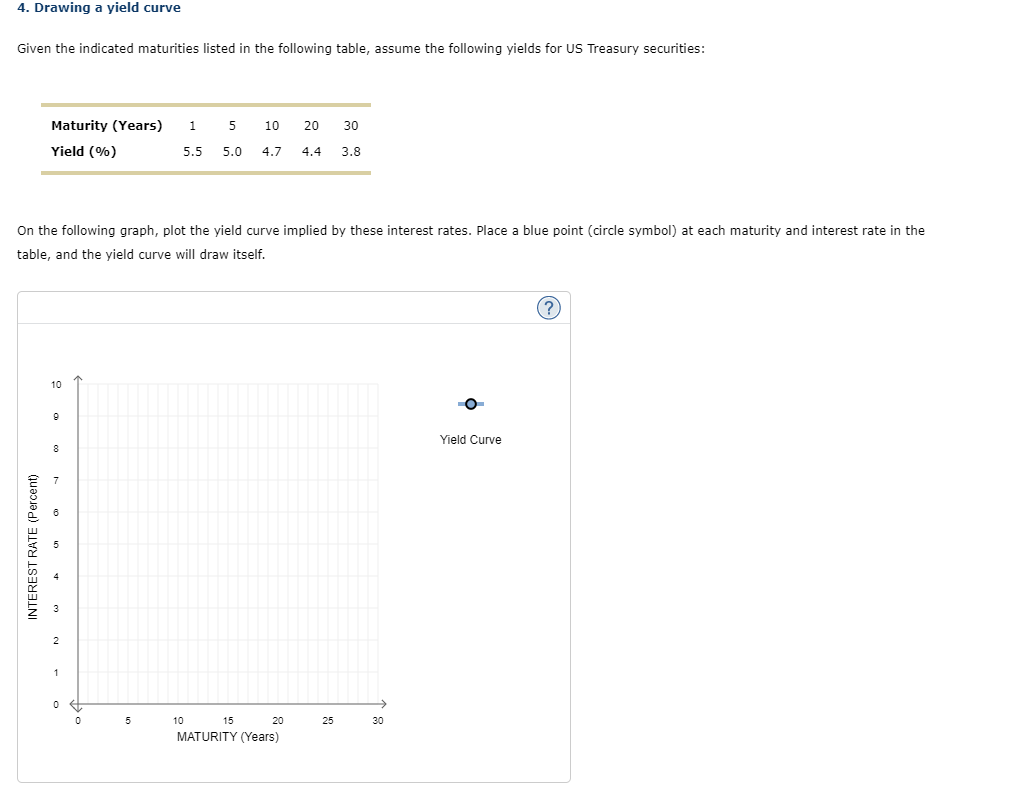
4. Drawing a yield curve Given the indicated maturities listed in the following table, assume the following yields for US Treasury securities: 1 5 10
Step by Step Solution
There are 3 Steps involved in it
Step: 1

Get Instant Access to Expert-Tailored Solutions
See step-by-step solutions with expert insights and AI powered tools for academic success
Step: 2

Step: 3
Ace Your Homework with AI
Get the answers you need in no time with our AI-driven, step-by-step assistance
Get Started
On My Own Two Feet A Modern Girls Guide To Personal Finance
Authors: Sharon Kedar
2nd Edition
1440570841, 978-1440570841