

Answered step by step
Verified Expert Solution
Question
1 Approved Answer
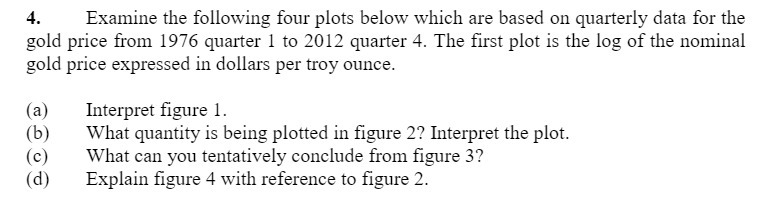
4. Examine the following four plots below which are based on quarterly data for the gold price from 1976 quarter 1 to 2012 quarter 4.
Step by Step Solution
There are 3 Steps involved in it
Step: 1

Get Instant Access to Expert-Tailored Solutions
See step-by-step solutions with expert insights and AI powered tools for academic success
Step: 2

Step: 3
Ace Your Homework with AI
Get the answers you need in no time with our AI-driven, step-by-step assistance
Get Started
Social And Economic Networks
Authors: Matthew O Jackson
1st Edition
140083399X, 9781400833993