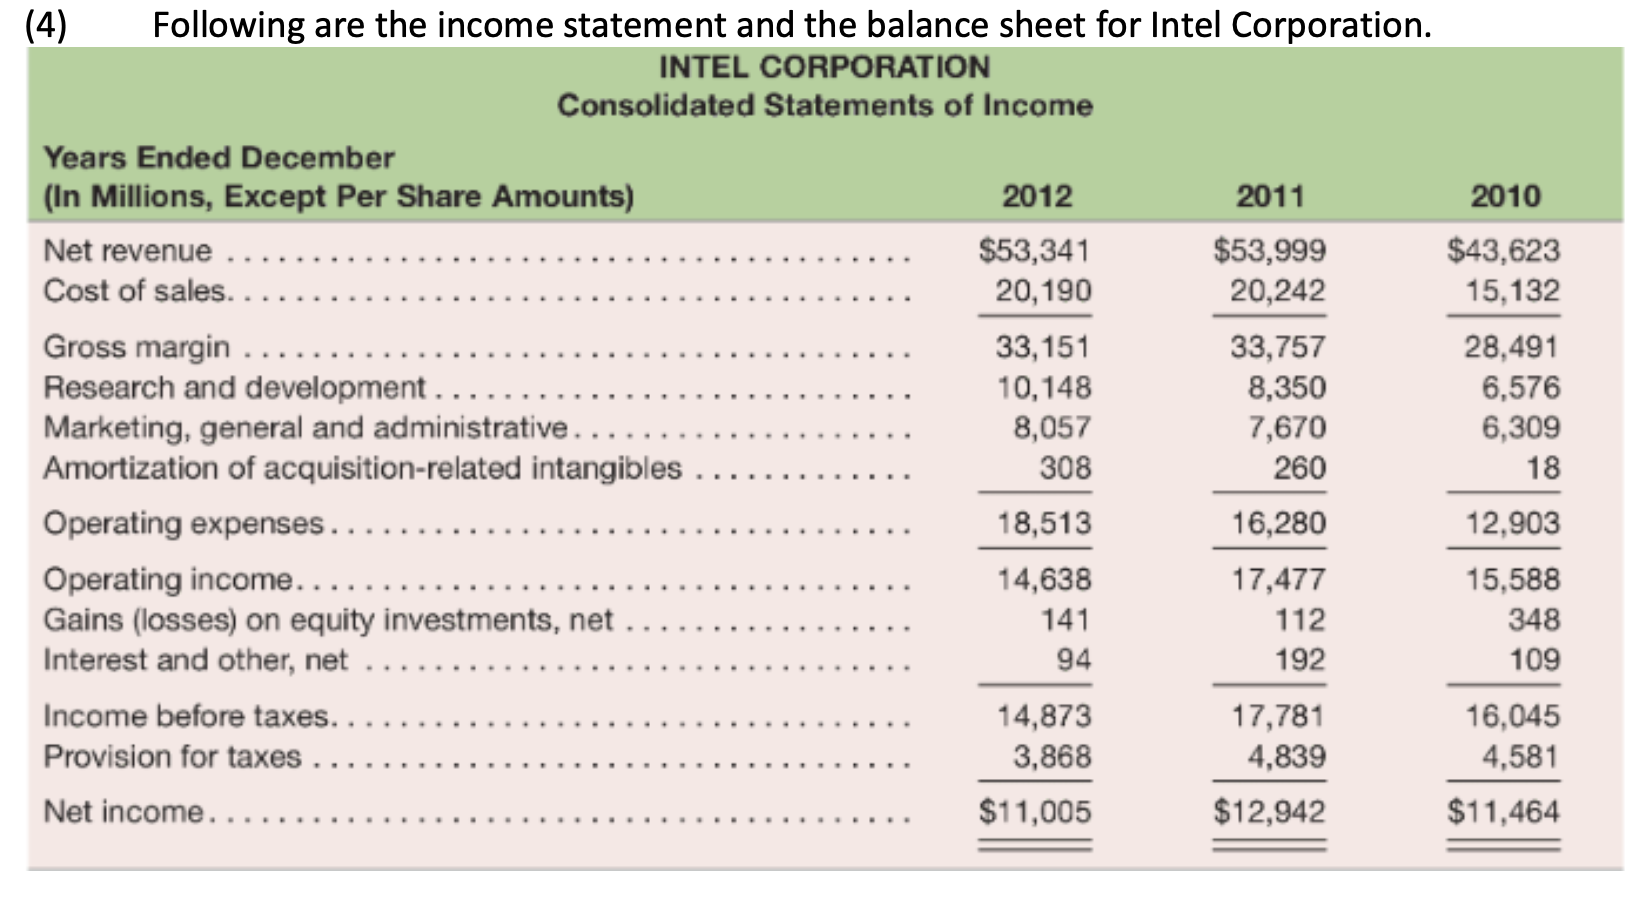
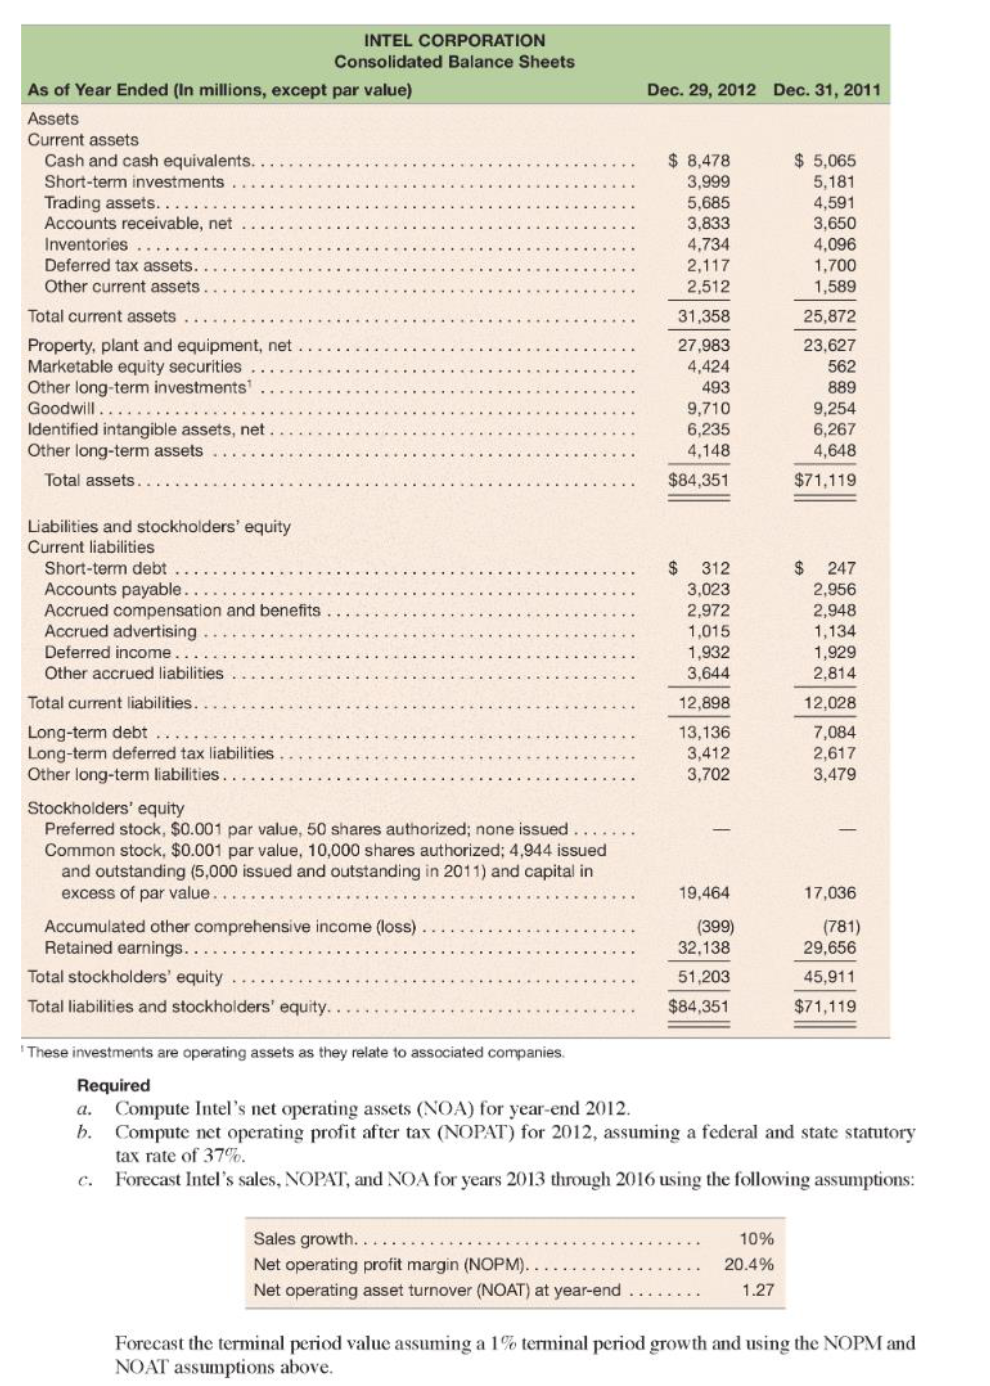
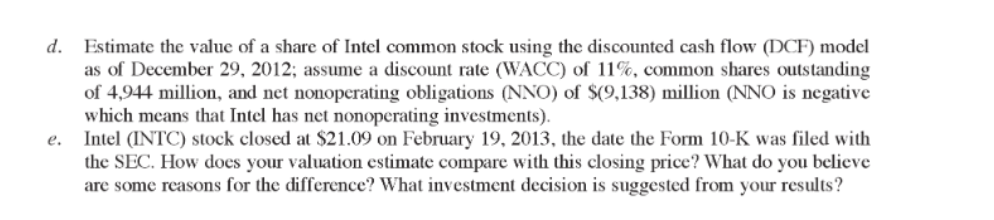
(4) Following are the income statement and the balance sheet for Intel Corporation. INTEL CORPORATION Consolidated Statements of Income Years Ended December (In Millions, Except Per Share Amounts) 2012 2011 2010 Net revenue $53,341 $53,999 $43,623 Cost of sales.. 20,190 20,242 15,132 Gross margin ..... 33,151 33,757 28,491 Research and development. 10,148 8,350 6,576 Marketing, general and administrative.... 8,057 7,670 6,309 Amortization of acquisition-related intangibles. 308 260 Operating expenses... 18,513 16,280 12,903 Operating income.... 14,638 17,477 15,588 Gains (losses) on equity investments, net 141 112 348 Interest and other, net 192 109 Income before taxes... 14,873 17,781 16,045 Provision for taxes. 3,868 4,839 4,581 Net income.. $11,005 $12,942 $11,464 18 94 Dec. 29, 2012 Dec. 31, 2011 INTEL CORPORATION Consolidated Balance Sheets As of Year Ended (In millions, except par value) Assets Current assets Cash and cash equivalents.. Short-term investments Trading assets.. Accounts receivable, net Inventories Deferred tax assets. Other current assets Total current assets Property, plant and equipment, net Marketable equity securities Other long-term investments Goodwill Identified intangible assets, net Other long-term assets Total assets. $ 8,478 3,999 5,685 3,833 4,734 2,117 2,512 31,358 27,983 4,424 493 9,710 6,235 4.148 $ 5,065 5,181 4,591 3,650 4,096 1,700 1,589 25,872 23.627 562 889 9,254 6,267 4,648 $71,119 $84,351 Liabilities and stockholders' equity Current liabilities Short-term debt Accounts payable. Accrued compensation and benefits Accrued advertising Deferred income Other accrued liabilities Total current liabilities. Long-term debt Long-term deferred tax liabilities Other long-term liabilities. $ 312 3,023 2,972 1,015 1,932 3,644 12,898 $ 247 2,956 2,948 1,134 1,929 2.814 12,028 13,136 3,412 3,702 7,084 2,617 3,479 19,464 17,036 Stockholders' equity Preferred stock, $0.001 par value, 50 shares authorized; none issued Common stock, $0.001 par value, 10,000 shares authorized; 4,944 issued and outstanding (5,000 issued and outstanding in 2011) and capital in excess of par value... Accumulated other comprehensive income (loss) Retained earnings... Total stockholders' equity Total liabilities and stockholders' equity. (399) 32,138 51,203 $84,351 (781) 29,656 45,911 $71,119 These investments are operating assets as they relate to associated companies Required a. Compute Intel's net operating assets (NOA) for year-end 2012. b. Compute net operating profit after tax (NOPAT) for 2012, assuming a federal and state statutory tax rate of 37%. Forecast Intel's sales, NOPAT, and NOA for years 2013 through 2016 using the following assumptions: Sales growth.... Net operating profit margin (NOPM)... Net operating asset turnover (NOAT) at year-end 10% 20.4% 1.27 Forecast the terminal period value assuming a 1% terminal period growth and using the NOPM and NOAT assumptions above. d. Estimate the value of a share of Intel common stock using the discounted cash flow (DCF) model as of December 29, 2012, assume a discount rate (WACC) of 11%, common shares outstanding of 4,944 million, and net nonoperating obligations (NNO) of $(9,138) million (NNO is negative which means that Intel has net nonoperating investments) Intel (INTC) stock closed at $21.09 on February 19, 2013, the date the Form 10-K was filed with the SEC. How does your valuation estimate compare with this closing price? What do you believe are some reasons for the difference? What investment decision is suggested from your results? e. (4) Following are the income statement and the balance sheet for Intel Corporation. INTEL CORPORATION Consolidated Statements of Income Years Ended December (In Millions, Except Per Share Amounts) 2012 2011 2010 Net revenue $53,341 $53,999 $43,623 Cost of sales.. 20,190 20,242 15,132 Gross margin ..... 33,151 33,757 28,491 Research and development. 10,148 8,350 6,576 Marketing, general and administrative.... 8,057 7,670 6,309 Amortization of acquisition-related intangibles. 308 260 Operating expenses... 18,513 16,280 12,903 Operating income.... 14,638 17,477 15,588 Gains (losses) on equity investments, net 141 112 348 Interest and other, net 192 109 Income before taxes... 14,873 17,781 16,045 Provision for taxes. 3,868 4,839 4,581 Net income.. $11,005 $12,942 $11,464 18 94 Dec. 29, 2012 Dec. 31, 2011 INTEL CORPORATION Consolidated Balance Sheets As of Year Ended (In millions, except par value) Assets Current assets Cash and cash equivalents.. Short-term investments Trading assets.. Accounts receivable, net Inventories Deferred tax assets. Other current assets Total current assets Property, plant and equipment, net Marketable equity securities Other long-term investments Goodwill Identified intangible assets, net Other long-term assets Total assets. $ 8,478 3,999 5,685 3,833 4,734 2,117 2,512 31,358 27,983 4,424 493 9,710 6,235 4.148 $ 5,065 5,181 4,591 3,650 4,096 1,700 1,589 25,872 23.627 562 889 9,254 6,267 4,648 $71,119 $84,351 Liabilities and stockholders' equity Current liabilities Short-term debt Accounts payable. Accrued compensation and benefits Accrued advertising Deferred income Other accrued liabilities Total current liabilities. Long-term debt Long-term deferred tax liabilities Other long-term liabilities. $ 312 3,023 2,972 1,015 1,932 3,644 12,898 $ 247 2,956 2,948 1,134 1,929 2.814 12,028 13,136 3,412 3,702 7,084 2,617 3,479 19,464 17,036 Stockholders' equity Preferred stock, $0.001 par value, 50 shares authorized; none issued Common stock, $0.001 par value, 10,000 shares authorized; 4,944 issued and outstanding (5,000 issued and outstanding in 2011) and capital in excess of par value... Accumulated other comprehensive income (loss) Retained earnings... Total stockholders' equity Total liabilities and stockholders' equity. (399) 32,138 51,203 $84,351 (781) 29,656 45,911 $71,119 These investments are operating assets as they relate to associated companies Required a. Compute Intel's net operating assets (NOA) for year-end 2012. b. Compute net operating profit after tax (NOPAT) for 2012, assuming a federal and state statutory tax rate of 37%. Forecast Intel's sales, NOPAT, and NOA for years 2013 through 2016 using the following assumptions: Sales growth.... Net operating profit margin (NOPM)... Net operating asset turnover (NOAT) at year-end 10% 20.4% 1.27 Forecast the terminal period value assuming a 1% terminal period growth and using the NOPM and NOAT assumptions above. d. Estimate the value of a share of Intel common stock using the discounted cash flow (DCF) model as of December 29, 2012, assume a discount rate (WACC) of 11%, common shares outstanding of 4,944 million, and net nonoperating obligations (NNO) of $(9,138) million (NNO is negative which means that Intel has net nonoperating investments) Intel (INTC) stock closed at $21.09 on February 19, 2013, the date the Form 10-K was filed with the SEC. How does your valuation estimate compare with this closing price? What do you believe are some reasons for the difference? What investment decision is suggested from your results? e