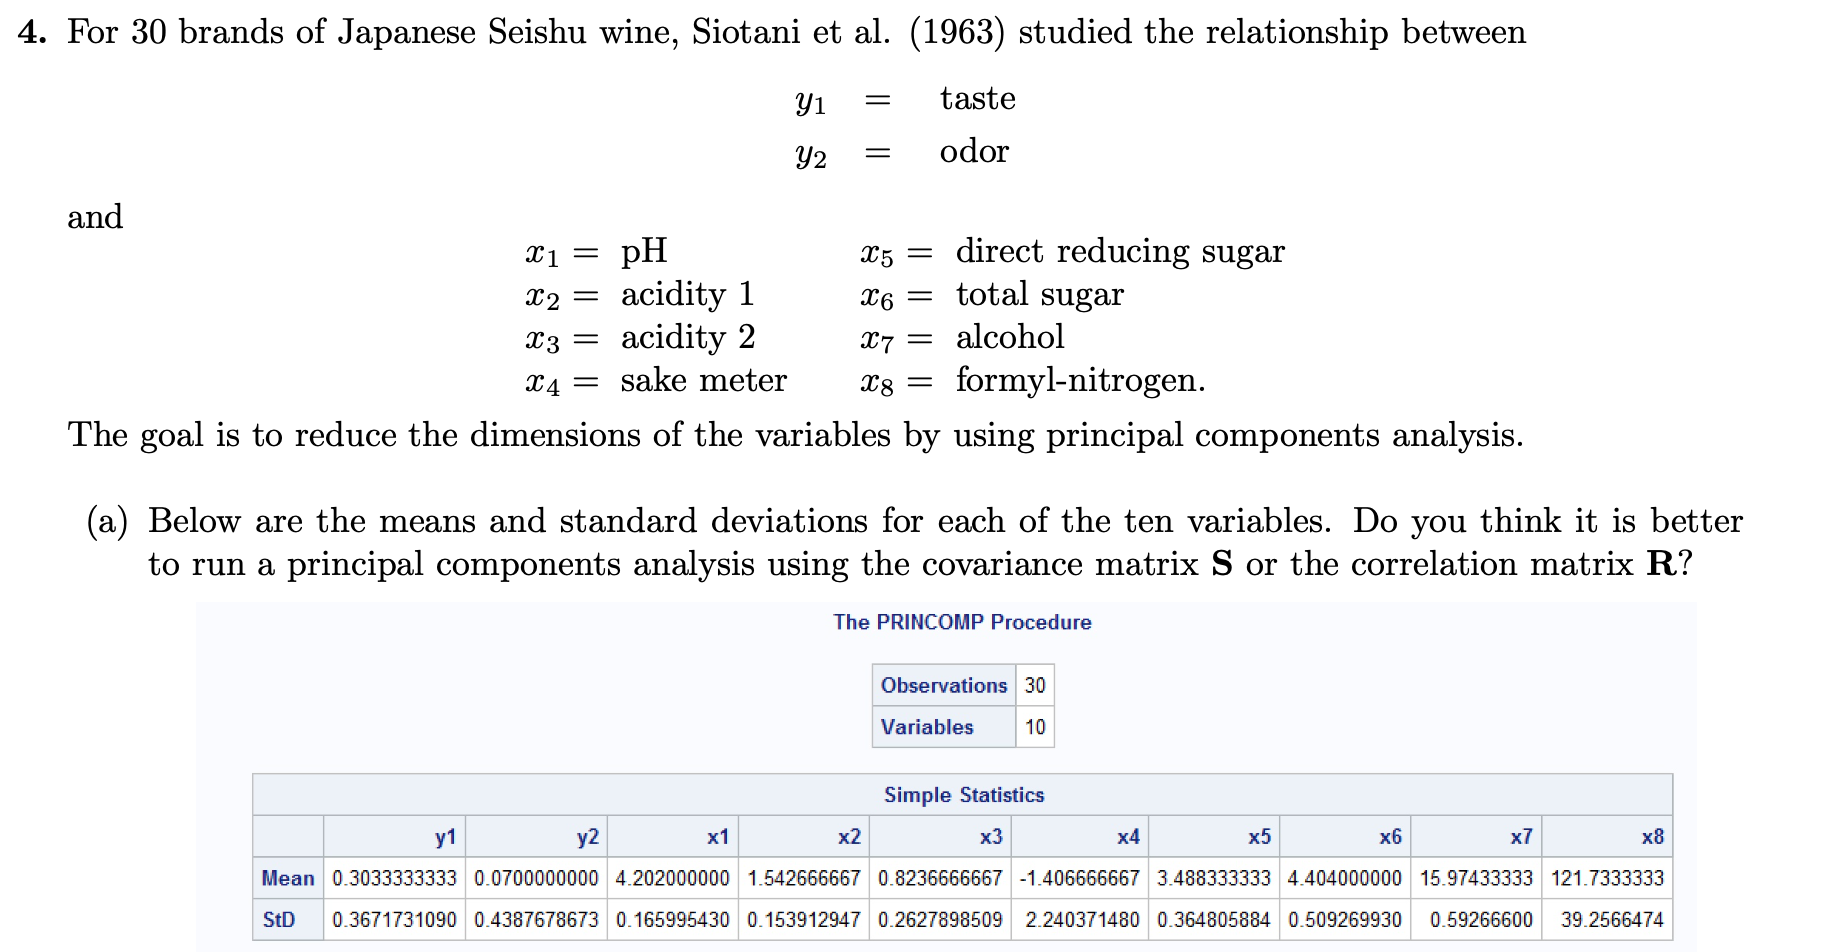
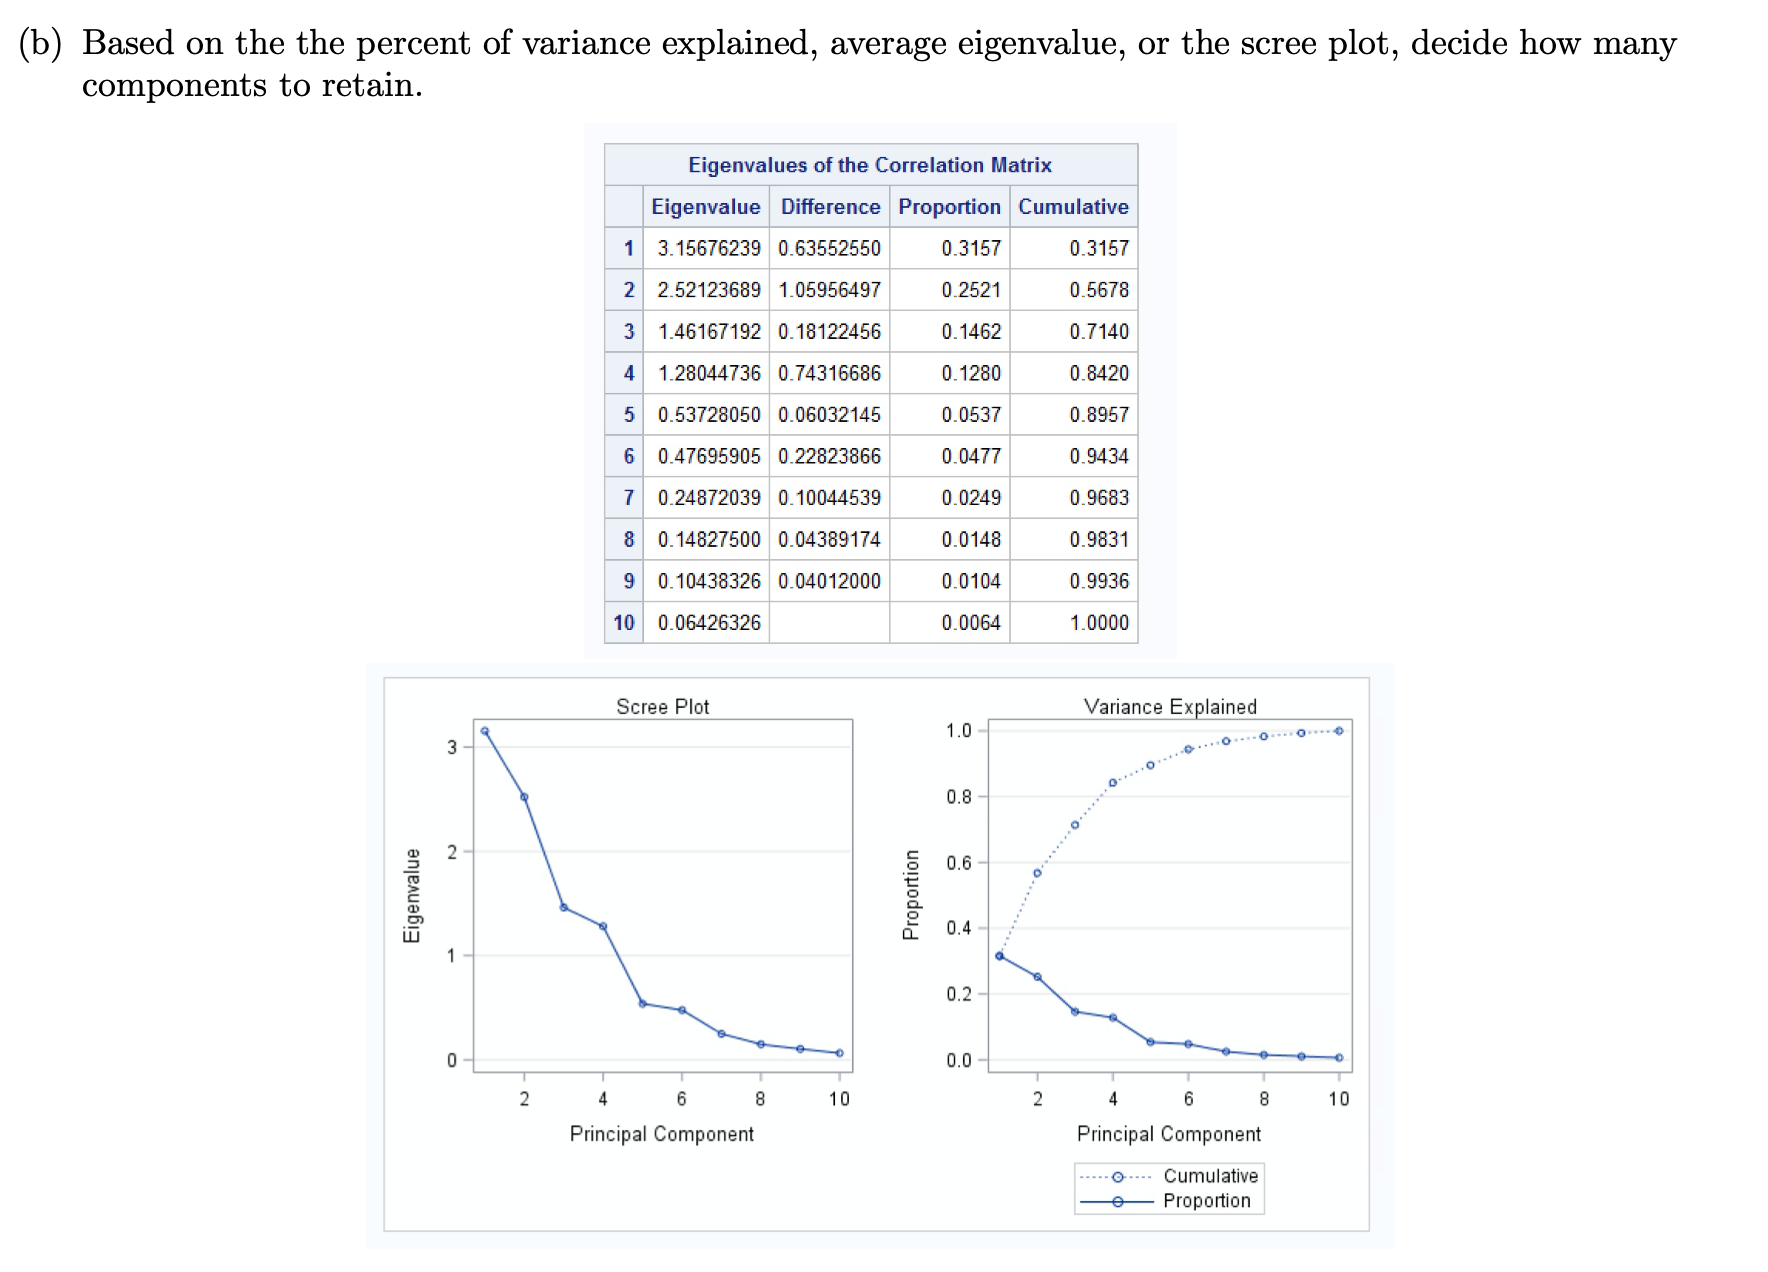
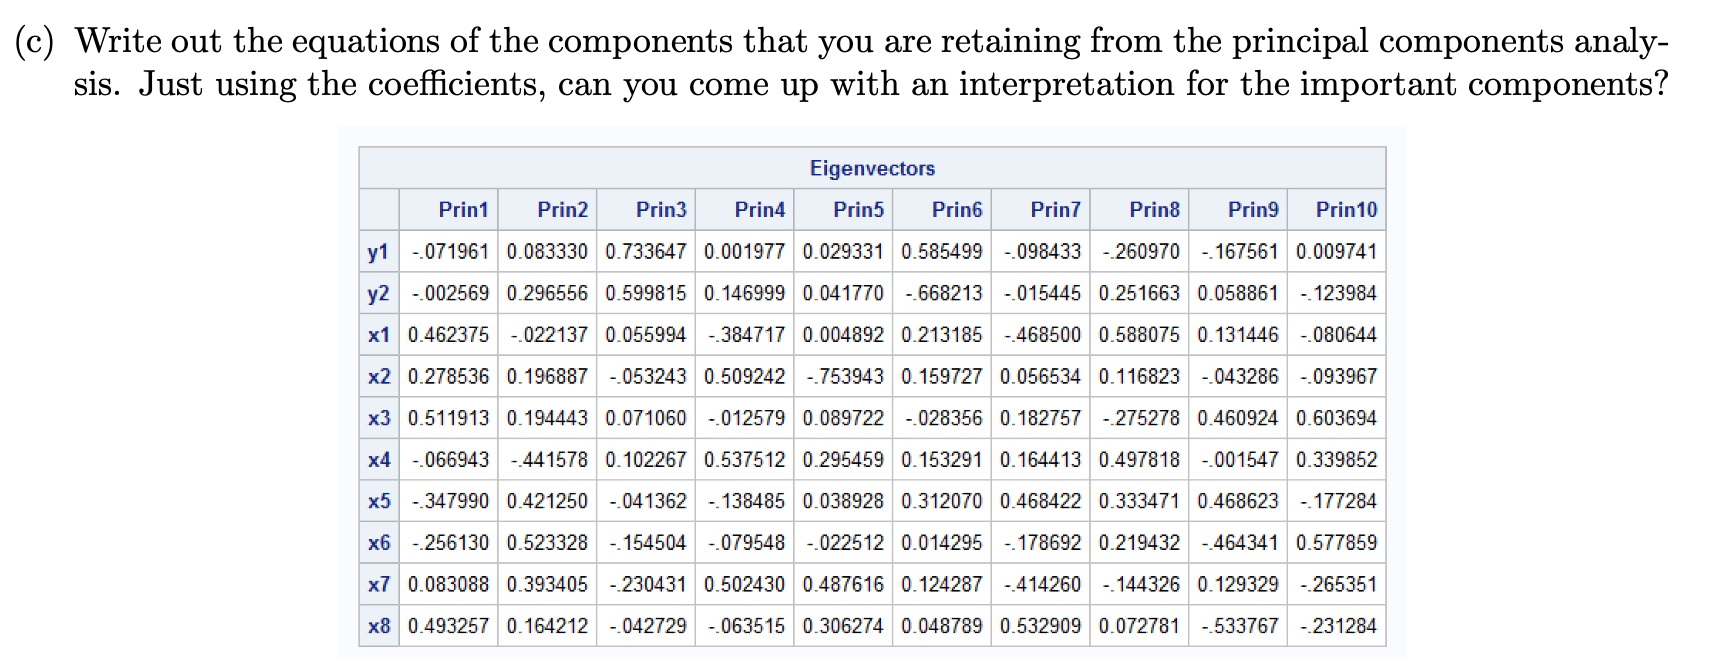
4. For 30 brands of Japanese Seishu wine, Siotani et al. (1963) studied the relationship between y1 = taste y2 = odor and C1 = PH X'5 = direct reducing sugar 2 = acidity 1 x6 = total sugar X3 = acidity 2 27 = alcohol 24 = sake meter X8 = formyl-nitrogen. The goal is to reduce the dimensions of the variables by using principal components analysis. (a) Below are the means and standard deviations for each of the ten variables. Do you think it is better to run a principal components analysis using the covariance matrix S or the correlation matrix R? The PRINCOMP Procedure Observations 30 Variables 10 Simple Statistics y1 y2 x1 x2 x3 x4 x5 x6 x7 x8 Mean 0.3033333333 0.0700000000 4.202000000 1.542666667 0.8236666667 -1.406666667 3.488333333 4.404000000 15.97433333 121.7333333 StD 0.3671731090 0.4387678673 0. 165995430 0. 153912947 0.2627898509 2.240371480 0.364805884 0.509269930 0.59266600 39.2566474(b) Based on the the percent of variance explained, average eigenvalue, or the scree plot, decide how many components to retain. Eigenvalues of the Correlation Matrix Eigenvalue Difference Proportion Cumulative 1 3. 15676239 0.63552550 0.3157 0.3157 2 2.52123689 1.05956497 0.2521 0.5678 3 1.46167192 0.18122456 0.1462 0.7140 4 1.28044736 0.74316686 0. 1280 0.8420 5 0.53728050 0.06032145 0.0537 0.8957 6 0.47695905 0.22823866 0.0477 0.9434 7 0.24872039 0. 10044539 0.0249 0.9683 8 0. 14827500 0.04389174 0.0148 0.9831 9 0 10438326 0.04012000 0.0104 0.9936 10 0.06426326 0.0064 1.0000 Scree Plot Variance Explained 1.0 O....0....0 3 0.8 N 0.6 . . ...............0 . ...... Proportion Eigenvalue 0.4 0.2 0 0.0 N 6 8 10 2 6 8 10 Principal Component Principal Component -....O.... Cumulative Proportion(c) Write out the equations of the components that you are retaining from the principal components analy- sis. Just using the coefficients, can you come up with an interpretation for the important components? Eigenvectors Prin1 Prin2 Prin3 Prin4 Prin5 Prin6 Prin7 Prin8 Prin9 Prin10 y1 -.071961 0.083330 0.733647 0.001977 0.029331 0.585499 -.098433 -.260970 -. 167561 0.009741 y2 -.002569 0.296556 0.599815 0. 146999 0.041770 -.668213 -.015445 0.251663 0.058861 -. 123984 x1 0.462375 -.022137 0.055994 -.384717 0.004892 0.213185 - 468500 0.588075 0.131446 -.080644 x2 0.278536 0. 196887 -.053243 0.509242 -.753943 0. 159727 0.056534 0. 116823 -.043286 -.093967 x3 0.511913 0. 194443 0.071060 -.012579 0.089722 -.028356 0. 182757 - 275278 0.460924 0.603694 x4 -.066943 - 441578 0.102267 0.537512 0.295459 0.153291 0.164413 0.497818 -.001547 0.339852 x5 -.347990 0.421250 -.041362 -. 138485 0.038928 0.312070 0.468422 0.333471 0.468623 -.177284 x6 -.256130 0.523328 -. 154504 -.079548 -.022512 0.014295 -. 178692 0.219432 - 464341 0.577859 x7 0.083088 0.393405 -230431 0.502430 0.487616 0.124287 -.414260 -. 144326 0.129329 -.265351 x8 0.493257 0.164212 -.042729 -.063515 0.306274 0.048789 0.532909 0.072781 -.533767 -.231284