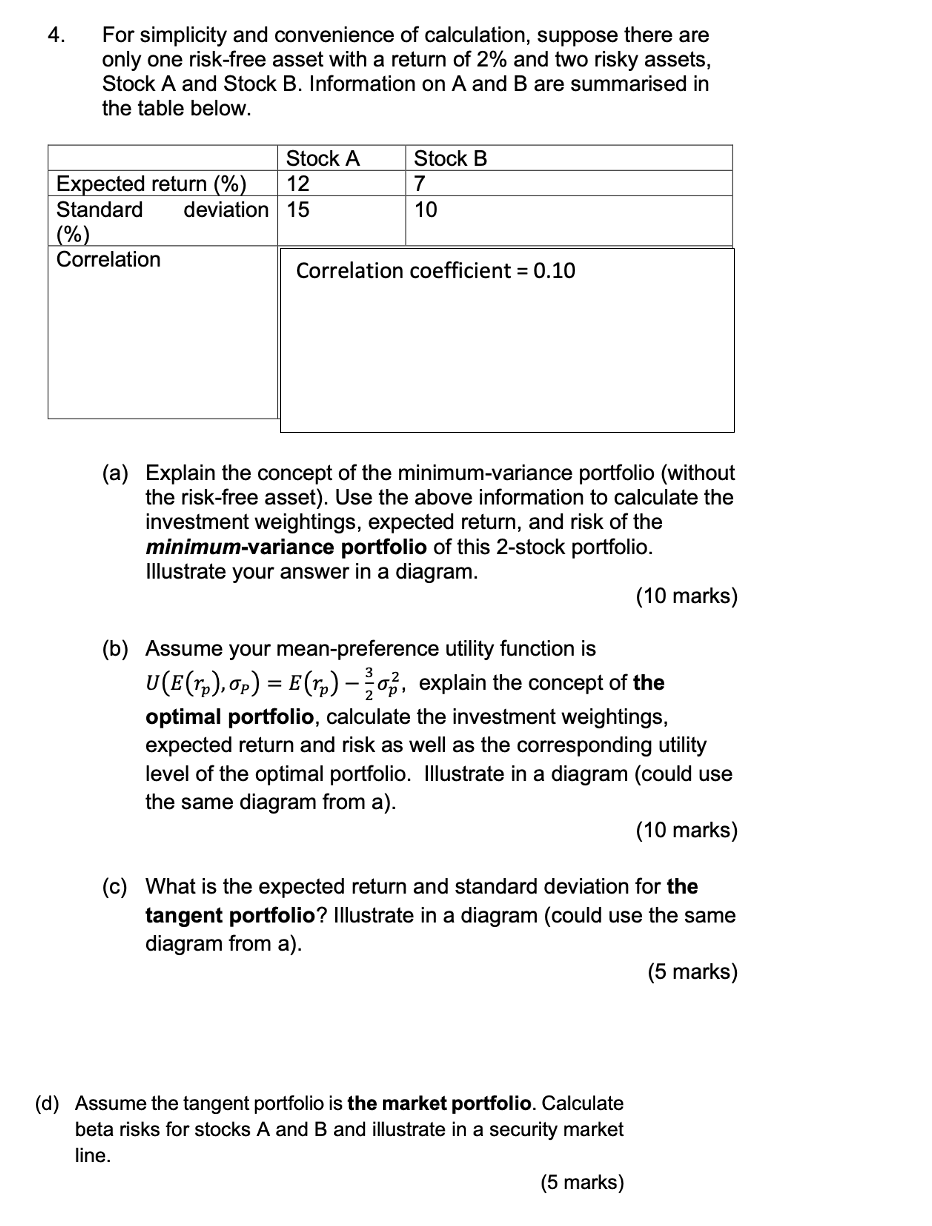
4. For simplicity and convenience of calculation, suppose there are only one risk-free asset with a return of 2% and two risky assets, Stock A and Stock B. Information on A and B are summarised in the table below. Stock A Stock B Expected return (%) 12 7 Standard deviation 15 10 (%) Correlation Correlation coefficient = 0.10 (a) Explain the concept of the minimum-variance portfolio (without the risk-free asset). Use the above information to calculate the investment weightings, expected return, and risk of the minimum-variance portfolio of this 2-stock portfolio. Illustrate your answer in a diagram. (10 marks) (b) Assume your mean-preference utility function is U(E(Tp), op) = E(Tp) , explain the concept of the optimal portfolio, calculate the investment weightings, expected return and risk as well as the corresponding utility level of the optimal portfolio. Illustrate in a diagram (could use the same diagram from a). (10 marks) (c) What is the expected return and standard deviation for the tangent portfolio? Illustrate in a diagram (could use the same diagram from a). (5 marks) (d) Assume the tangent portfolio is the market portfolio. Calculate beta risks for stocks A and B and illustrate in a security market line. (5 marks) 4. For simplicity and convenience of calculation, suppose there are only one risk-free asset with a return of 2% and two risky assets, Stock A and Stock B. Information on A and B are summarised in the table below. Stock A Stock B Expected return (%) 12 7 Standard deviation 15 10 (%) Correlation Correlation coefficient = 0.10 (a) Explain the concept of the minimum-variance portfolio (without the risk-free asset). Use the above information to calculate the investment weightings, expected return, and risk of the minimum-variance portfolio of this 2-stock portfolio. Illustrate your answer in a diagram. (10 marks) (b) Assume your mean-preference utility function is U(E(Tp), op) = E(Tp) , explain the concept of the optimal portfolio, calculate the investment weightings, expected return and risk as well as the corresponding utility level of the optimal portfolio. Illustrate in a diagram (could use the same diagram from a). (10 marks) (c) What is the expected return and standard deviation for the tangent portfolio? Illustrate in a diagram (could use the same diagram from a). (5 marks) (d) Assume the tangent portfolio is the market portfolio. Calculate beta risks for stocks A and B and illustrate in a security market line


