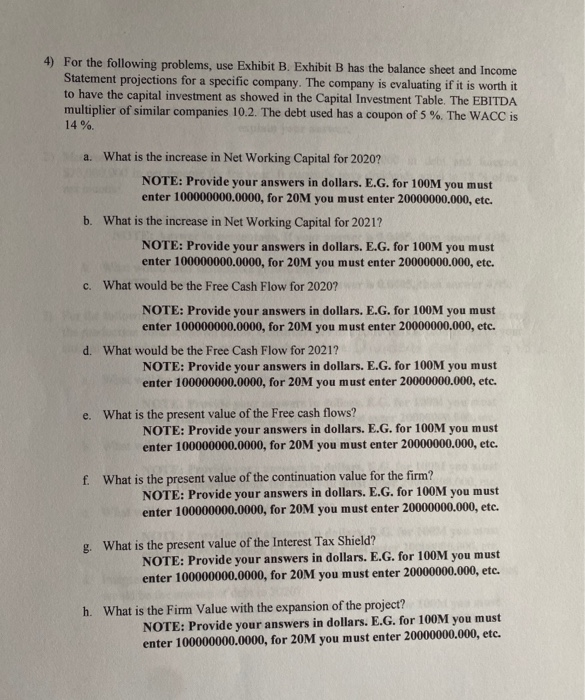
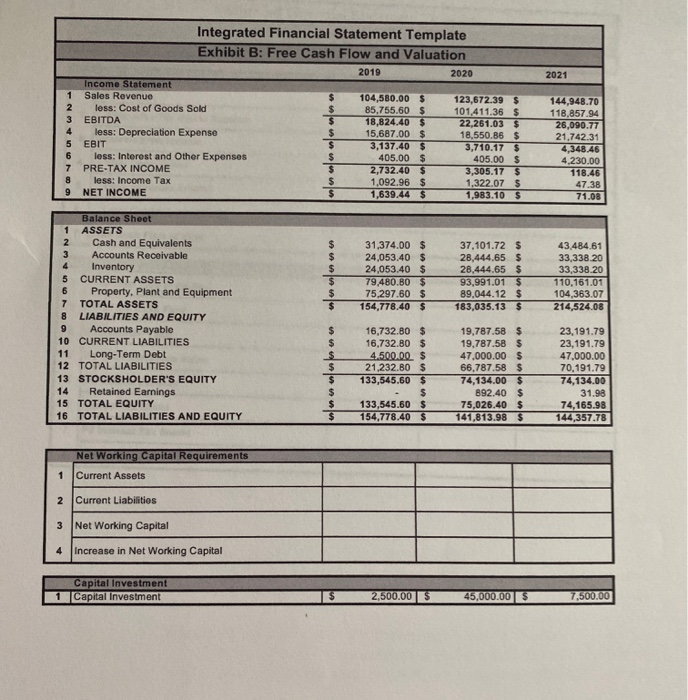
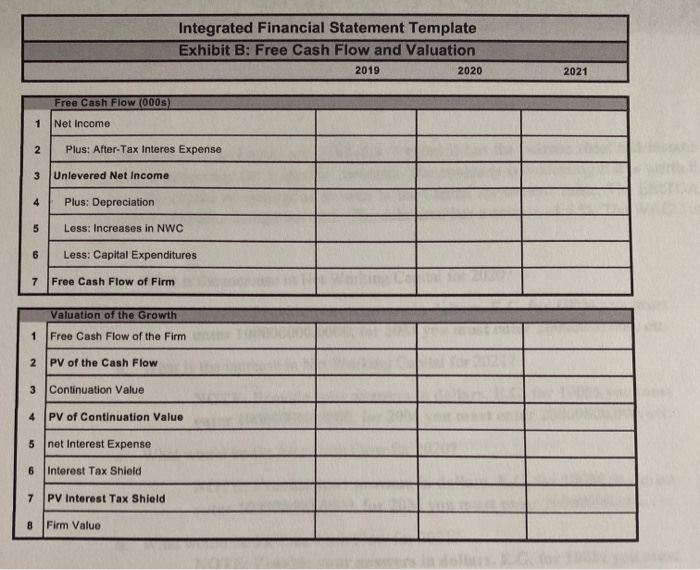
4) For the following problems, use Exhibit B. Exhibit B has the balance sheet and Income Statement projections for a specific company. The company is evaluating if it is worth it to have the capital investment as showed in the Capital Investment Table. The EBITDA multiplier of similar companies 10.2. The debt used has a coupon of 5 %. The WACC is 14 % a. What is the increase in Net Working Capital for 2020? NOTE: Provide your answers in dollars. E.G. for 100M you must enter 100000000.0000, for 20M you must enter 20000000.000, etc. b. What is the increase in Net Working Capital for 2021? NOTE: Provide your answers in dollars. E.G. for 100M you must enter 100000000.0000, for 20M you must enter 20000000.000, etc. c. What would be the Free Cash Flow for 2020? NOTE: Provide your answers in dollars. E.G. for 100M you must enter 100000000.0000, for 20M you must enter 20000000.000, etc. d. What would be the Free Cash Flow for 2021? NOTE: Provide your answers in dollars. E.G. for 100M you must enter 100000000.0000, for 20M you must enter 20000000.000, etc. e. What is the present value of the Free cash flows? NOTE: Provide your answers in dollars. E.G. for 100M you must enter 100000000.0000, for 20M you must enter 20000000.000, etc. f. What is the present value of the continuation value for the firm? NOTE: Provide your answers in dollars. E.G. for 100M you must enter 100000000.0000, for 20M you must enter 20000000.000, etc. g. What is the present value of the Interest Tax Shield? NOTE: Provide your answers in dollars. E.G. for 100M you must enter 100000000.0000, for 20M you must enter 20000000.000, etc. h. What is the Firm Value with the expansion of the project? NOTE: Provide your answers in dollars. E.G. for 100M you must enter 100000000.0000, for 20M you must enter 20000000.000, etc. 2021 Integrated Financial Statement Template Exhibit B: Free Cash Flow and Valuation 2019 2020 Income Statement 1 Sales Revenue 104,580.00 $ 123,672.39 $ 2 less: Cost of Goods Sold 85,755.60 $ 101,411.36 $ 3 EBITDA 18,824.40 $ 22.261.03 $ 4 less: Depreciation Expense 15,687.00 $ 18,550.86 $ 5 EBIT 3,137.40 $ 3,710.17 $ 6 less: Interest and Other Expenses 405.00 $ 405.00 $ 7 PRE-TAX INCOME 2,732.40 $ 3,305.17 $ 8 less: Income Tax 1,092.96 $ 1,322.07 $ 9 NET INCOME 1,639.44 $ 1,983.10 $ I els nos ensen 144,948.70 118.857.94 26,090.77 21.742.31 4,348.46 4.230.00 118.46 47.38 71.08 los enlesena 31,374.00 24.053.40 24,053.40 79,480.80 75.297.60 154,778.40 $ $ $ $ $ $ 37,101.72 $ 28,444.65 $ 28,444.65 $ 93,991.01 $ 89,044.12 $ 183,035.13 $ 43,484.61 33,338.20 33,338.20 110,161.01 104,363.07 214,524.08 Balance Sheet ASSETS Cash and Equivalents 3 Accounts Receivable Inventory 5 CURRENT ASSETS 6 Property. Plant and Equipment 7 TOTAL ASSETS 8 LIABILITIES AND EQUITY 9 Accounts Payable 10 CURRENT LIABILITIES 11 Long-Term Debt 12 TOTAL LIABILITIES 13 STOCKSHOLDER'S EQUITY 14 Retained Earnings 15 TOTAL EQUITY 16 TOTAL LIABILITIES AND EQUITY nestos en 16,732.80 $ 16.732.80 $ 4.500.00 $ 21.232.80 $ 133,545.60 $ - S 133,545.60 $ 154,778.40 $ 19,787.58 $ 19,787.58 $ 47,000.00 $ 66,787.58 $ 74,134.00 $ 892.40 $ 75,026.40 $ 141,813.98 $ 23,191.79 23,191.79 47,000.00 70.191.79 74,134.00 31.98 74,165.98 144,357.78 Net Working Capital Requirements Current Assets 1 Current Liabilities Net Working Capital 4 Increase in Net Working Capital Capital Investment 1 Capital Investment 2,500.00 $ 45,000.00 $ 7,500.00 Integrated Financial Statement Template Exhibit B: Free Cash Flow and Valuation 2019 2020 Free Cash Flow (0008) Net Income Plus: After-Tax Interes Expense Unlevered Net Income Plus: Depreciation Less: Increases in NWC Less: Capital Expenditures 7 Free Cash Flow of Firm Valuation of the Growth 1 Free Cash Flow of the Firm PV of the Cash Flow Continuation Value PV of Continuation Value on net interest Expense Interest Tax Shield Shield PV Interest Tax Shield 8 Firm Value