

Answered step by step
Verified Expert Solution
Question
1 Approved Answer
4 From the below-given data Calculate Frequency distribution (4Marks) Bar graph and Pie chart. (2Marks) write your analysis. (4Marks) ) (10 ) The following are
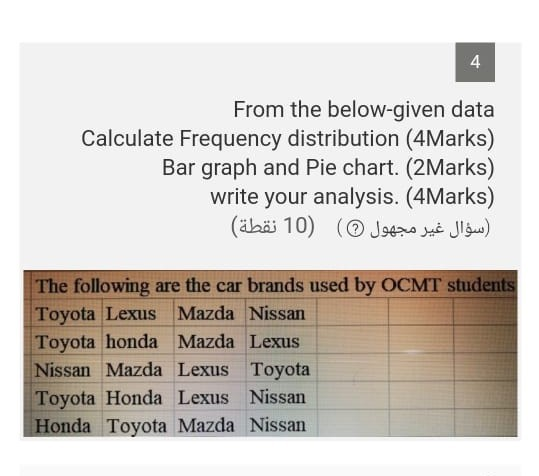
4 From the below-given data Calculate Frequency distribution (4Marks) Bar graph and Pie chart. (2Marks) write your analysis. (4Marks) ) (10 ) The following are the car brands used by OCMT students Toyota Lexus Mazda Nissan Toyota honda Mazda Lexus Nissan Mazda Lexus Toyota Toyota Honda Lexus Nissan Honda Toyota Mazda Nissan
Step by Step Solution
There are 3 Steps involved in it
Step: 1

Get Instant Access to Expert-Tailored Solutions
See step-by-step solutions with expert insights and AI powered tools for academic success
Step: 2

Step: 3
Ace Your Homework with AI
Get the answers you need in no time with our AI-driven, step-by-step assistance
Get Started
Value Based Management For Accounts Receivable
Authors: Kimberly Don Ketron
1505911184, 978-1505911183