Answered step by step
Verified Expert Solution
Question
1 Approved Answer
4. Measurement of Systematic Risk Suppose that you consider investing in the following stocks - PNM Resources (PNM), Target Corporation (TGT), and Marriot International (MAR).


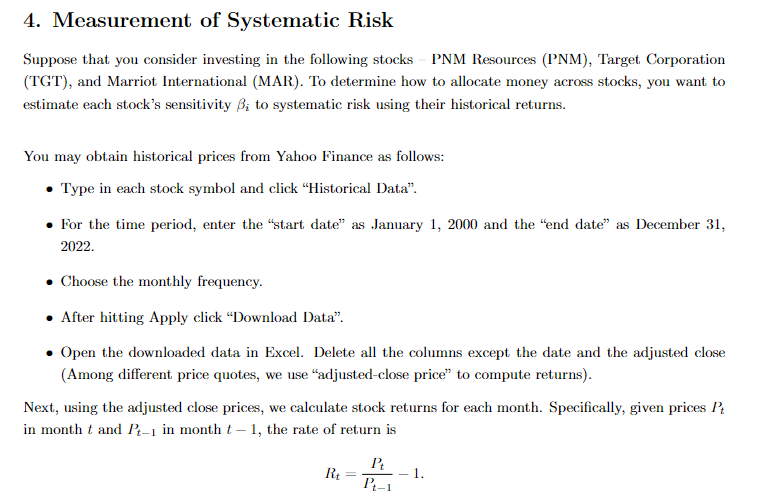
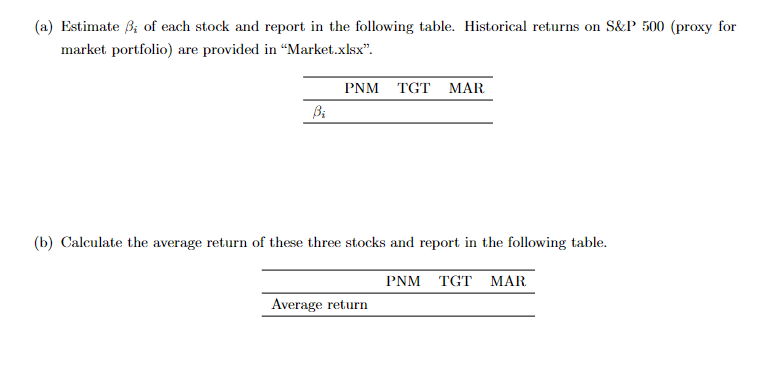
 4. Measurement of Systematic Risk Suppose that you consider investing in the following stocks - PNM Resources (PNM), Target Corporation (TGT), and Marriot International (MAR). To determine how to allocate money across stocks, you want to estimate each stock's sensitivity i to systematic risk using their historical returns. You may obtain historical prices from Yahoo Finance as follows: - Type in each stock symbol and click "Historical Data". - For the time period, enter the "start date" as January 1, 2000 and the "end date" as December 31, 2022. - Choose the monthly frequency. - After hitting Apply click "Download Data". - Open the downloaded data in Excel. Delete all the columns except the date and the adjusted close (Among different price quotes, we use "adjusted-close price" to compute returns). Next, using the adjusted close prices, we calculate stock returns for each month. Specifically, given prices Pt in month t and Pt1 in month t1, the rate of return is Rt=Pt1Pt1 (a) Estimate i of each stock and report in the following table. Historical returns on S\&P 500 (proxy for market portfolio) are provided in "Market.xlsx". (b) Calculate the average return of these three stocks and report in the following table. (c) Using the statistics found in (a) and (b), draw a scatter plot, where X variables are i, and Y variables are the average return. (d) Do you see a relationship between i and average return
 Step by Step Solution
There are 3 Steps involved in it
Step: 1

Get Instant Access to Expert-Tailored Solutions
See step-by-step solutions with expert insights and AI powered tools for academic success
Step: 2

Step: 3

Ace Your Homework with AI
Get the answers you need in no time with our AI-driven, step-by-step assistance
Get Started


