Answered step by step
Verified Expert Solution
Link Copied!

Question

1 Approved Answer

4.) On sheet 2 of the excel spreadsheet, you will find a data set. Use this data set to perform the following. . a.) Plot

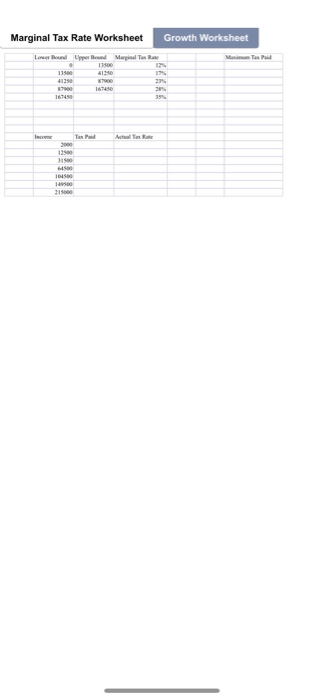
image text in transcribed
4.) On sheet 2 of the excel spreadsheet, you will find a data set. Use this data set to perform the following. . a.) Plot Time vs. population for the different populations. b.) Classify each of the datasets as having a linear or exponential trend c.) Fit the proper trendline to each dataset. d.) At what time would each of the different datasets be expected to reach a population value of 5200? e.) At what population value would each of the different datasets be expected to be at if we were in year 40? Marginal Tax Rate Worksheet G Growth Worksheet 12500 4.) On sheet 2 of the excel spreadsheet, you will find a data set. Use this data set to perform the following. . a.) Plot Time vs. population for the different populations. b.) Classify each of the datasets as having a linear or exponential trend c.) Fit the proper trendline to each dataset. d.) At what time would each of the different datasets be expected to reach a population value of 5200? e.) At what population value would each of the different datasets be expected to be at if we were in year 40? Marginal Tax Rate Worksheet G Growth Worksheet 12500

Step by Step Solution

There are 3 Steps involved in it

Step: 1

blur-text-image

Get Instant Access to Expert-Tailored Solutions

See step-by-step solutions with expert insights and AI powered tools for academic success

Step: 2

blur-text-image_2

Step: 3

blur-text-image_3

Ace Your Homework with AI

Get the answers you need in no time with our AI-driven, step-by-step assistance

Get Started

Recommended Textbook for

2001 Miller Local Government Audits

Authors: Rhett D. Harrell

1st Edition

015607219X, 978-0156072199

More Books

Students also viewed these Accounting questions