

Answered step by step
Verified Expert Solution
Question
1 Approved Answer
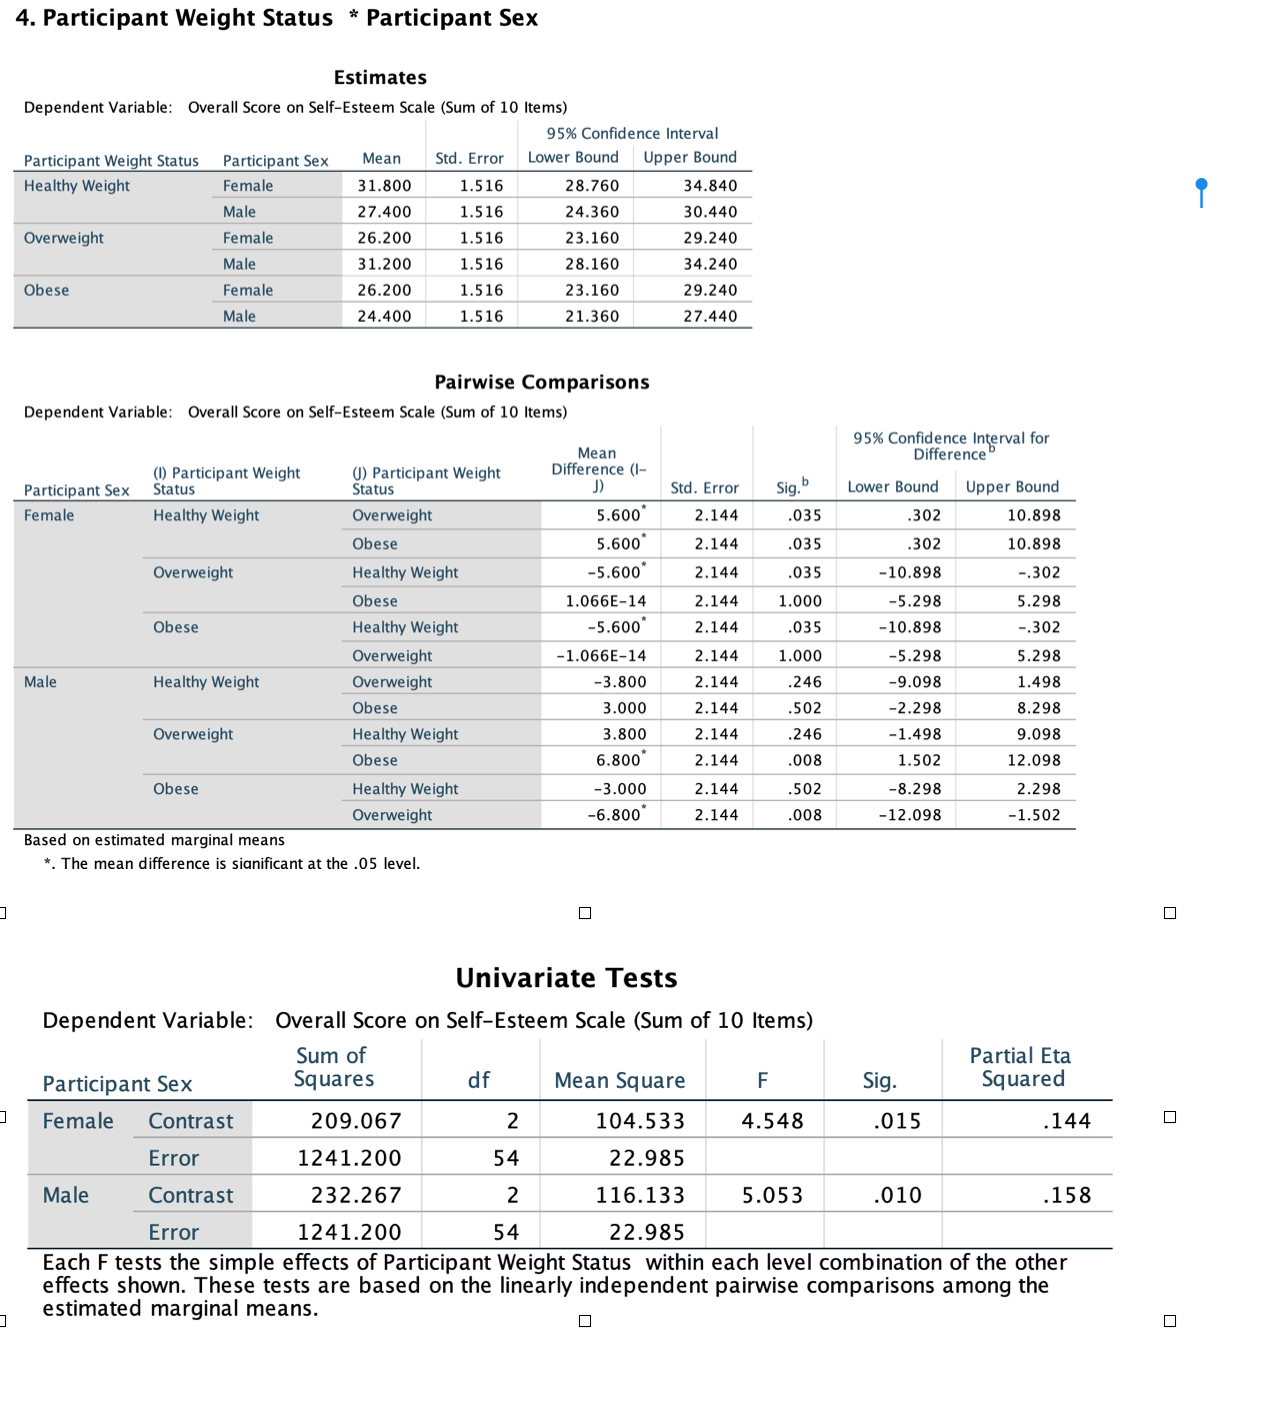
4. Participant Weight Status * Participant Sex Estimates Dependent Variable: Overall Score on Self-Esteem Scale (Sum of 10 Items) 95% Confidence Interval Participant Weight Status
Step by Step Solution
There are 3 Steps involved in it
Step: 1

Get Instant Access to Expert-Tailored Solutions
See step-by-step solutions with expert insights and AI powered tools for academic success
Step: 2

Step: 3
Ace Your Homework with AI
Get the answers you need in no time with our AI-driven, step-by-step assistance
Get Started
Statistical Inference
Authors: George Casella, Roger L. Berger
2nd edition
0534243126, 978-0534243128