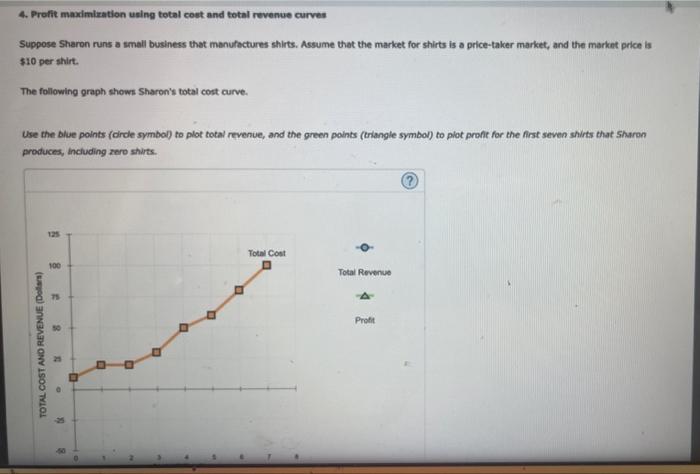
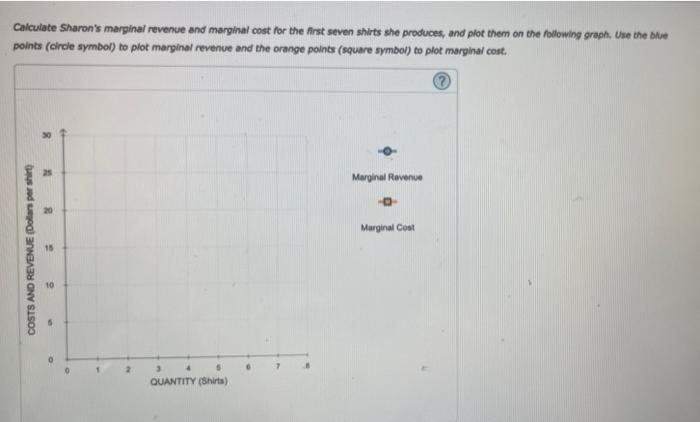
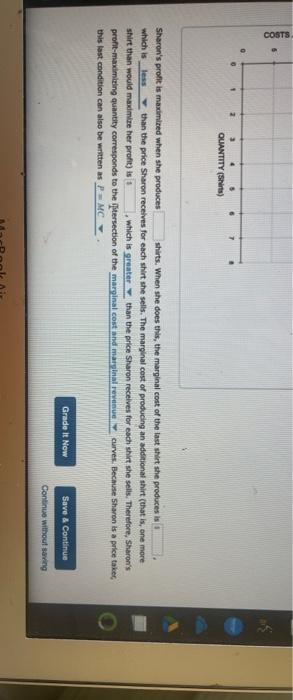
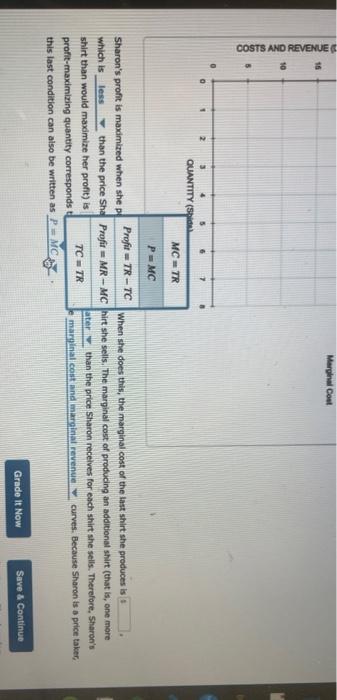
4. Preft maximization using total cost and total revenue curves Suppose Sharon runs a small business that manuhactures shirts. Assume that the market for shirts is a price-taker market, and the market price is $10 per shirt. The following graph shews Sharon's total cost curve. Use the Blue points (drcle symbal) to plot total revenue, and the green points (criangle symbol) to plot proft for the first seven shirts that sharon produces, including 2ero shirts. Calculate Sharon's marginal revenue and manghal cost for the first seven shirts she produces, and plot them on the following graph, Use the blue points (circle symbol) to plot marginal revenue and the orange points (square symbol) to plot marginal cost. Sharen's profic is maximined when she produces stirts. When she does this, the marginal cost of the last shirt she produces is which is than the price sharon receives for each shirt she sells. The marginal cest of preducing an additicnal shirt (that is, one more shirt than would maximite her profit) is , which is than the price Sharen receives for esch shirt she seils, Therefore, Sharon's profit-maximiting quantity corresponds to the fitersection of the curves. Because Sharon is a price taker, this last condition can also be written as Sharon's profit is maximized when she produces the iast shirt she produces is which is than the price Sharon receives for each sh ring an additional shirt (that in, one more shirt than would maximixe her profit) is , which is grea for each shirt she selte. Therefore, Shaten's profit-maximizing quantity corresponds to the intersection of the marginal cogt and marginal revenue curves. Gecause Sharon is a price takec, this last condition can atse be witten as Profir =TRTC When she does this, the marginal cost of the last shirt she preduces is Profir=MRMC hirt she sells. The marginal cost of produding an additionat shirt (that is, one more than the price Sharon recelves for each shirt she sells. Therefore, 5haroe's TC=TR curves. Because Sharon is a price taker, P=MC2


